
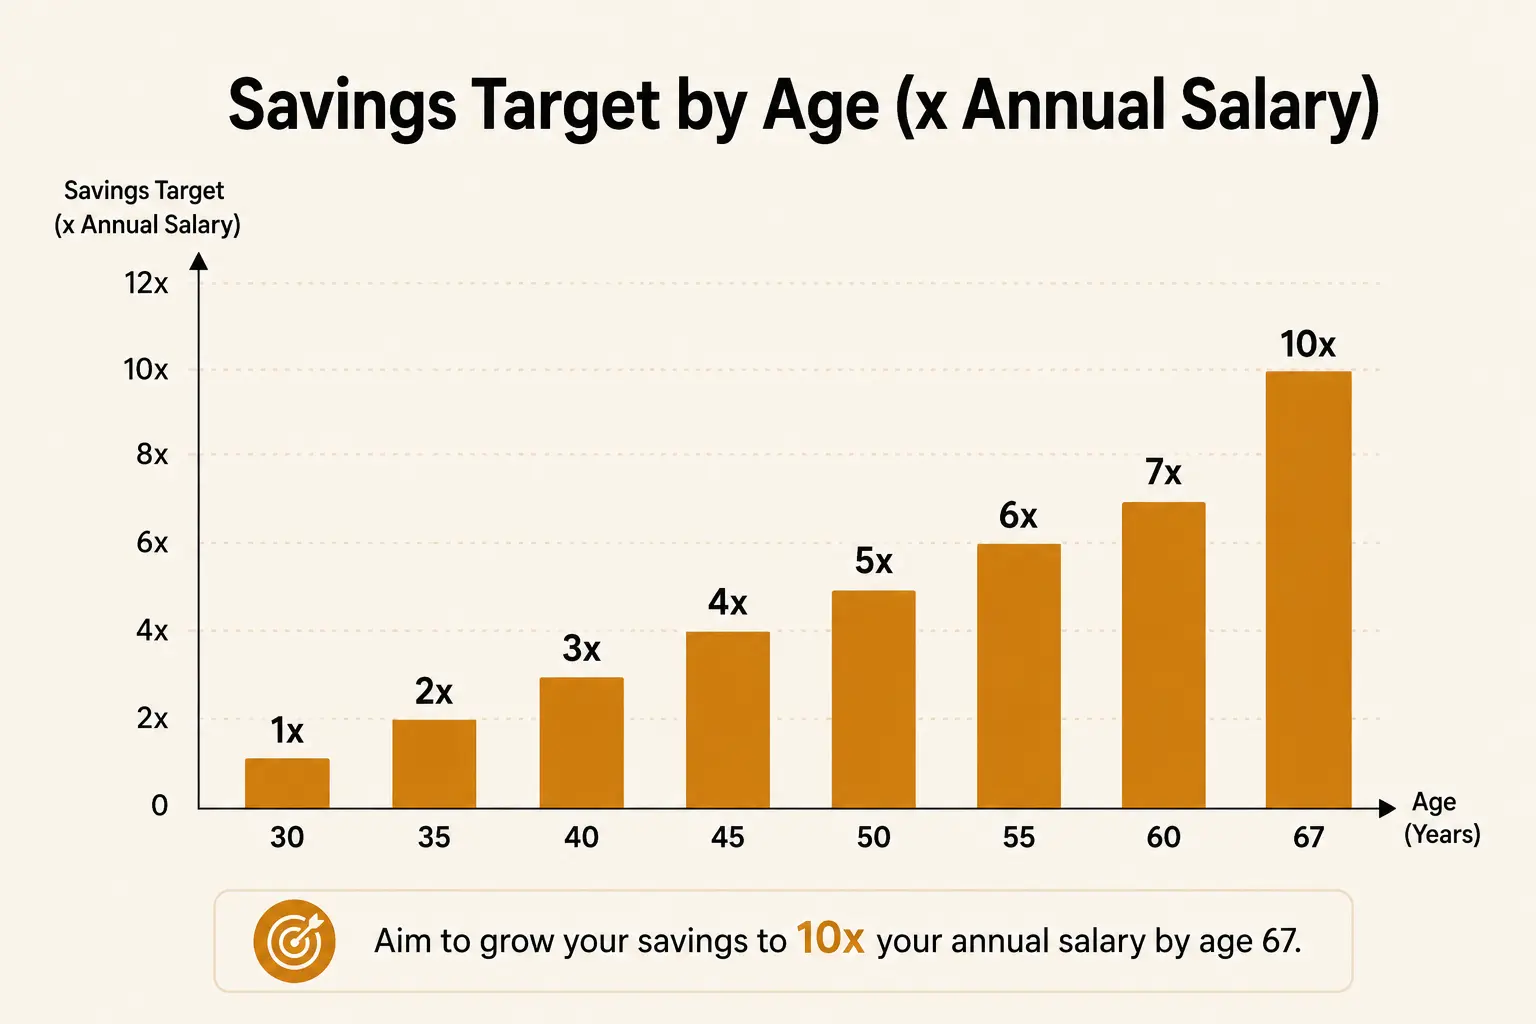
- The most widely cited benchmark (Fidelity) is 1x annual salary saved by 30, 3x by 40, and 6x by 50, rising to 10x by 67.
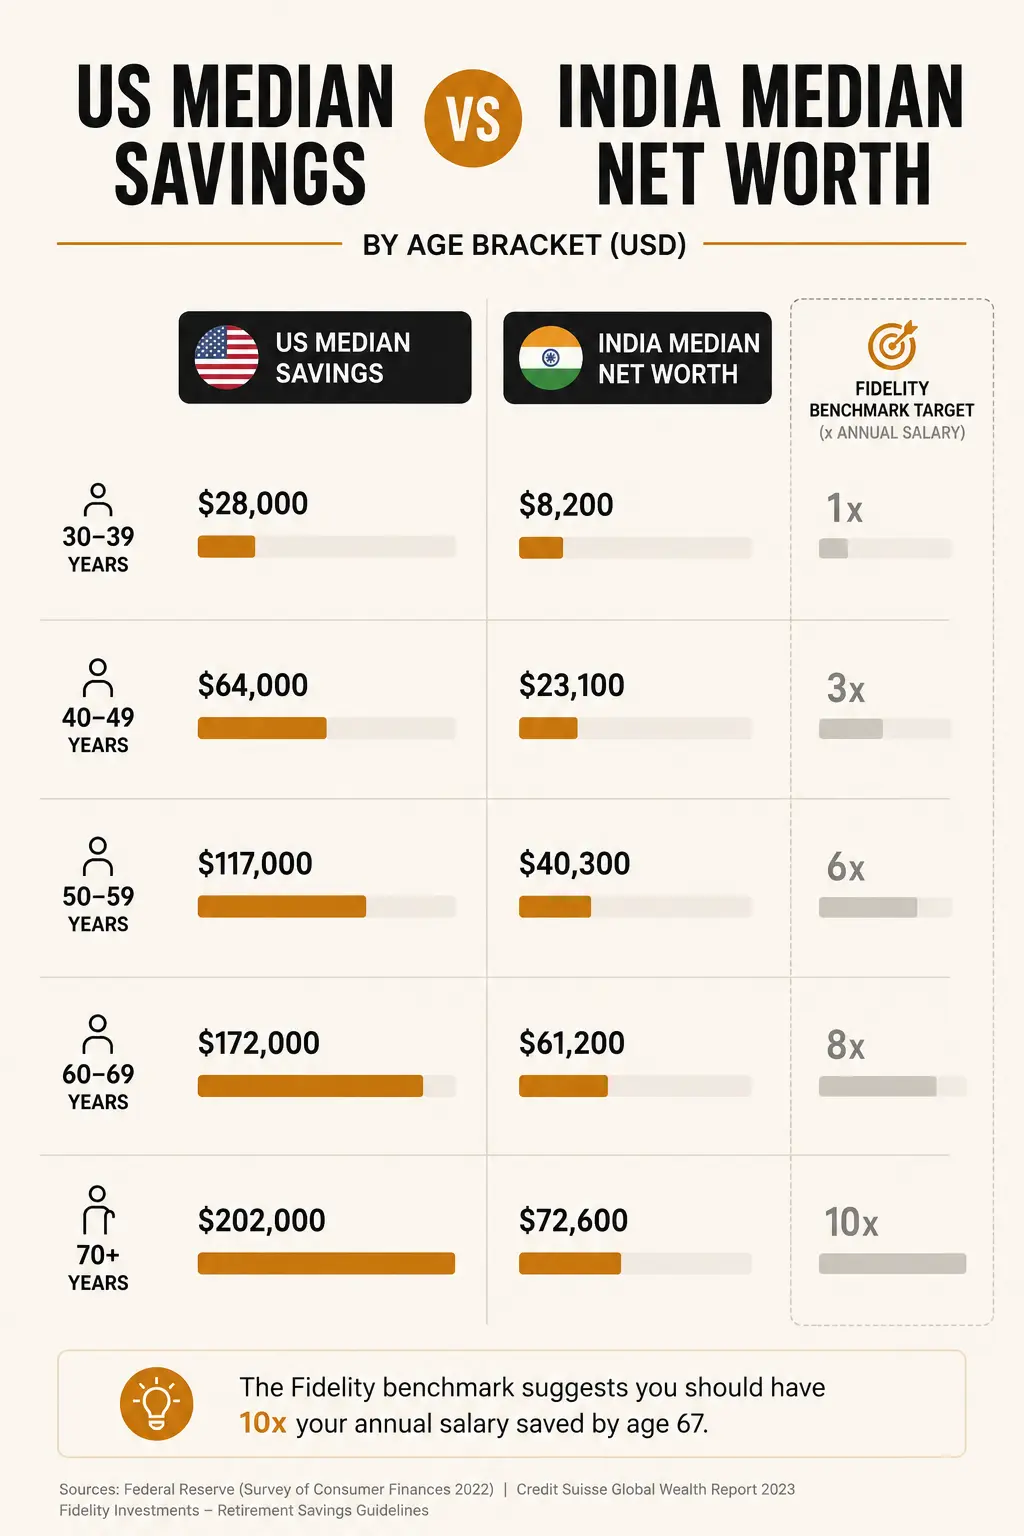
- The median American is significantly below every one of these targets — one estimate puts the typical 30-year-old about 67% below benchmark.
- Median US retirement savings by age: ~$18,880 (under 35), ~$45,000 (35-44), ~$115,000 (45-54).
- In India, median household net worth is roughly ₹10 lakh, with only about 1% of Indians above ₹1 crore.
- Starting age matters enormously: reaching the same corpus can require roughly double the monthly contribution if you start investing just five years later.
The most commonly cited savings benchmark says you should have roughly 1x your annual salary saved by 30, 3x by 40, and 6x by 50 — and the honest reality is that most people, across most income levels, are nowhere close.[1] This isn't a personal failure so much as a reflection of how aggressive these targets actually are. What follows is the full benchmark table, how real households actually compare, why the benchmark breaks down for a lot of people, and what to focus on instead of the gap itself.
The Standard Benchmark Table
Fidelity's widely cited salary-multiple guideline is the most commonly referenced savings benchmark, built around reaching roughly 10x your final salary by retirement age.[1] The full table, extrapolated across a working life:
| Age | Savings target (multiple of annual salary) |
|---|---|
| 30 | 1x |
| 35 | 2x |
| 40 | 3x |
| 45 | 4x |
| 50 | 6x |
| 55 | 7x |
| 60 | 8x |
| 67 (retirement target) | 10x |
On a $75,000 salary, this translates to $75,000 saved by 30, $225,000 by 40, and $450,000 by 50 — specifically in retirement-oriented accounts (401(k)s, IRAs, or their equivalents), not total net worth.
How Real Households Actually Compare
The gap between the benchmark and reality is substantial and well documented — the median American is significantly below every one of these targets, and one Federal Reserve-based estimate puts the typical 30-year-old around 67% below the age-30 benchmark.[2]
| Age group | US median retirement savings |
|---|---|
| Under 35 | ~$18,880 |
| 35-44 | ~$45,000 |
| 45-54 | ~$115,000 |
| 55-64 | ~$185,000 |
| 65-74 | ~$200,000 |
The Picture in India
India's household wealth data tells a similar story through a different lens — median net worth is roughly ₹10 lakh nationally, and only about 1% of Indians have a net worth above ₹1 crore.[3] By age bracket, median net worth is roughly ₹5 lakh for 25-34 year-olds, climbing to ₹75 lakh-1 crore by the 55-65 bracket — figures that lean heavily on real estate and gold rather than liquid investments.
India-specific savings-rate guidance tends to be framed as a percentage of income rather than a fixed multiple: broadly, saving around 20% of income in your 20s and early 30s, rising to 25-30% in your 40s if targeting a standard retirement age, and 40-50% if targeting early retirement.[4] A common SIP (systematic investment plan) pattern is starting around ₹2,000/month in your 20s and stepping up to ₹10,000-15,000/month by your 30s as income grows — see how compound interest actually works for why that step-up matters more than the starting amount.
Why the Benchmark Breaks Down for a Lot of People
High earners in particular are often poorly served by salary multiples specifically, since replacement-income needs differ sharply by income level — someone who saves 40% of a high income needs far less saved relative to salary than someone spending 90% of a smaller paycheck to cover fixed costs. For high earners, a spending-based approach tends to be more accurate: estimate your expected annual expenses in retirement and multiply by 25, rather than working off a multiple of current salary.[5]
What Actually Counts as "Savings" Here
Most salary-multiple benchmarks specifically mean invested retirement savings — 401(k)s, IRAs, or in the Indian context, EPF, PPF, and mutual fund/equity investments — not your total net worth and not your emergency fund balance.
The free Net Worth Tracker separates these categories automatically, so you can see your retirement-specific progress against the benchmark alongside your full net worth picture in one place.
If You're Behind the Benchmark
- Increase your savings rate now, not the gap itself. Fixating on how far behind you are is far less useful than making the next realistic increase to your contribution percentage.
- Front-load increases where possible. Starting age matters more than almost any other factor — reaching the same corpus can require roughly double the monthly contribution if you start five years later.
- Use raises and bonuses to step up contributions, rather than letting lifestyle spending absorb the full increase — even a portion redirected compounds meaningfully over a decade.
- Check employer matching first. An unmatched employer contribution is the single easiest gap to close, since it's effectively an immediate, guaranteed return.
- Track net worth broadly, not just the benchmark multiple. A full picture — including debt payoff progress and emergency fund status — often shows more genuine progress than the narrow retirement-only figure alone.
Common Mistakes
- Treating the benchmark as a pass/fail test. These are rough guidelines built on national averages, not a personalized verdict on your financial life.
- Comparing total net worth to a retirement-specific multiple. Home equity and other assets aren't what these benchmarks are measuring — compare like with like.
- Ignoring the spending-based alternative if you're a high earner. Salary multiples can meaningfully overstate what a high earner actually needs relative to their real expenses.
- Waiting to "catch up later" instead of increasing contributions now. The cost of delay compounds — five years matters more than most people assume.
- Ignoring free money. Not capturing a full employer match, when available, is one of the most common and most avoidable gaps.
Final Thoughts
Savings benchmarks by age are a useful reference point, not a verdict — the median household in both the US and India sits well below the commonly cited targets, which says more about how aggressive the targets are than about individual failure. The number that actually matters most isn't where you stand today against a national average; it's whether your savings rate is moving in the right direction and whether you've captured the easy wins — employer matching, an early SIP step-up, a full emergency fund — that compound the most over time.
The honest version of this topic: the benchmark is a snapshot most people miss. What predicts your actual outcome is your savings rate and how early you started raising it — not the gap you're standing in today.
For the fuller financial picture beyond savings alone, building a one-page financial plan and understanding the FIRE movement's math both cover how these benchmarks fit into a longer-term strategy.
Sources
[1] Average and median net worth by age — Fidelity savings guidelines. Available at: fidelity.com
[2] Federal Reserve data on retirement savings by age, benchmark comparison. Available at: nerdwallet.com
[3] Average net worth by age in India. Available at: hisabhkaro.com
[4] Percentage of income to save by age, India context. Available at: tatacapitalmoneyfy.com
[5] Limitations of salary-multiple benchmarks, spending-based alternative for high earners. Available at: troweprice.com