
The fixed deposit versus mutual fund question is the foundational personal finance debate in India. It is also one of the most poorly framed, because the framing usually assumes the question is about returns — which product gives more money — when the actual question is about which instrument is appropriate for a specific purpose given a specific investor's situation.
An FD giving 7.5 percent interest is not inferior to an equity mutual fund giving 12 percent CAGR as a general statement. For a specific purpose — parking three months of emergency expenses, saving for a home down payment in eighteen months, or managing the money of a retired parent who cannot absorb capital loss — the FD may be the correct instrument regardless of the return differential. For a different purpose — building retirement savings over twenty years, investing a portion of a surplus that is not needed for the foreseeable future — the equity mutual fund may be the correct instrument regardless of the short-term volatility.
This article makes the comparison honestly, across multiple dimensions, without the motivated reasoning that tends to characterise FD advocacy (returns are guaranteed, nothing can go wrong) or mutual fund advocacy (equities always win over the long run, FDs destroy wealth). The answer to 'which is better' is always: it depends, and here is specifically what it depends on.
What Each Instrument Actually Is
Fixed deposits
A fixed deposit is a contract between you and a bank (or NBFC, or post office) in which you deposit a sum of money for a defined tenure and receive a guaranteed interest rate. The interest rate is fixed at the time of deposit and does not change with market conditions during the tenure. At maturity, you receive the principal plus accrued interest.
FDs are governed by the Banking Regulation Act. Deposits up to ₹5 lakhs per depositor per bank are insured by DICGC (Deposit Insurance and Credit Guarantee Corporation), covering both principal and interest. This makes bank FDs among the safest financial instruments available to Indian retail investors. Use the FD calculator to see exactly what a deposit will return at any tenure and rate.
Mutual funds
A mutual fund pools money from many investors and deploys it into a portfolio of securities — equity, debt, or a combination — managed by a professional fund manager or tracked against an index. The unit holder's investment grows or falls with the market value of the underlying portfolio. Returns are not guaranteed; the NAV (Net Asset Value) per unit can fall below the purchase price.
Mutual funds are regulated by SEBI and structured as trusts — the fund assets are separate from the AMC's balance sheet. If the AMC faces financial difficulty, the fund's assets are not affected. Mutual fund investments are not government-insured but are not subject to the credit risk of a single institution — the portfolio's risk is distributed across the underlying securities. For equity mutual funds specifically, the most accessible starting point is a systematic investment plan (SIP), which removes the need to time the market.
The Return Comparison: What the Numbers Actually Show
Return comparison between FDs and mutual funds is only meaningful when done after-tax, after-inflation, and over a comparable time period. Most popular comparisons fail on at least one of these dimensions.
Nominal returns: current rates
| Instrument | Current rate / return range | Guaranteed? | Varies with? |
|---|---|---|---|
| Bank FD (major scheduled banks) | 6.5–7.5% p.a. (2024–25) | Yes, at deposit | Changes with each new deposit at prevailing rate; existing deposit locked at original rate |
| Small finance bank FD | 8–9% p.a. (2024–25) | Yes, at deposit | Higher rate reflects higher credit risk; DICGC insured up to ₹5L |
| Post office time deposit (5 year) | 7.5% p.a. (quarterly compounding) | Yes; government-backed | Set quarterly by Government of India; does not change during the tenure |
| Liquid mutual funds | 6.5–7% p.a. (approximate 1-year rolling) | No | Changes daily with market rates; no lock-in |
| Short-duration debt mutual funds | 7–8% p.a. (approximate 1–3 year rolling) | No | Changes with interest rate environment and credit spreads |
| Balanced advantage / hybrid funds | 9–12% p.a. (approximate 5-year rolling) | No | Mix of equity and debt; significant short-term volatility |
| Large-cap equity mutual funds | 10–14% p.a. (approximate 10-year rolling) | No; significant short-term variability | Equity market performance; can be negative in any given year |
| Diversified equity / flexi-cap funds | 11–15% p.a. (approximate 10-year rolling) | No | Broader equity exposure; higher long-run expected return with higher short-term volatility |
The key observation: at short durations (under one year), the return difference between FDs and debt mutual funds is modest and often in the FD's favour after accounting for short-term capital gains tax on mutual fund redemptions. At longer durations (five years and above), equity mutual funds have historically produced substantially higher returns than FDs — with the caveat that any specific five or ten-year period may show lower-than-average equity returns.
The inflation reality check
Nominal returns are misleading without adjusting for inflation. A 7.5 percent FD return in an environment of 5.5 percent average consumer price inflation (India's approximate long-run CPI average) produces a real return of approximately 2 percent. That is positive real return — the money is growing in purchasing power — but modestly so.
| Investment | Nominal return | Assumed inflation | Real return | ₹1 lakh after 20 years (nominal) | ₹1 lakh after 20 years (real purchasing power) |
|---|---|---|---|---|---|
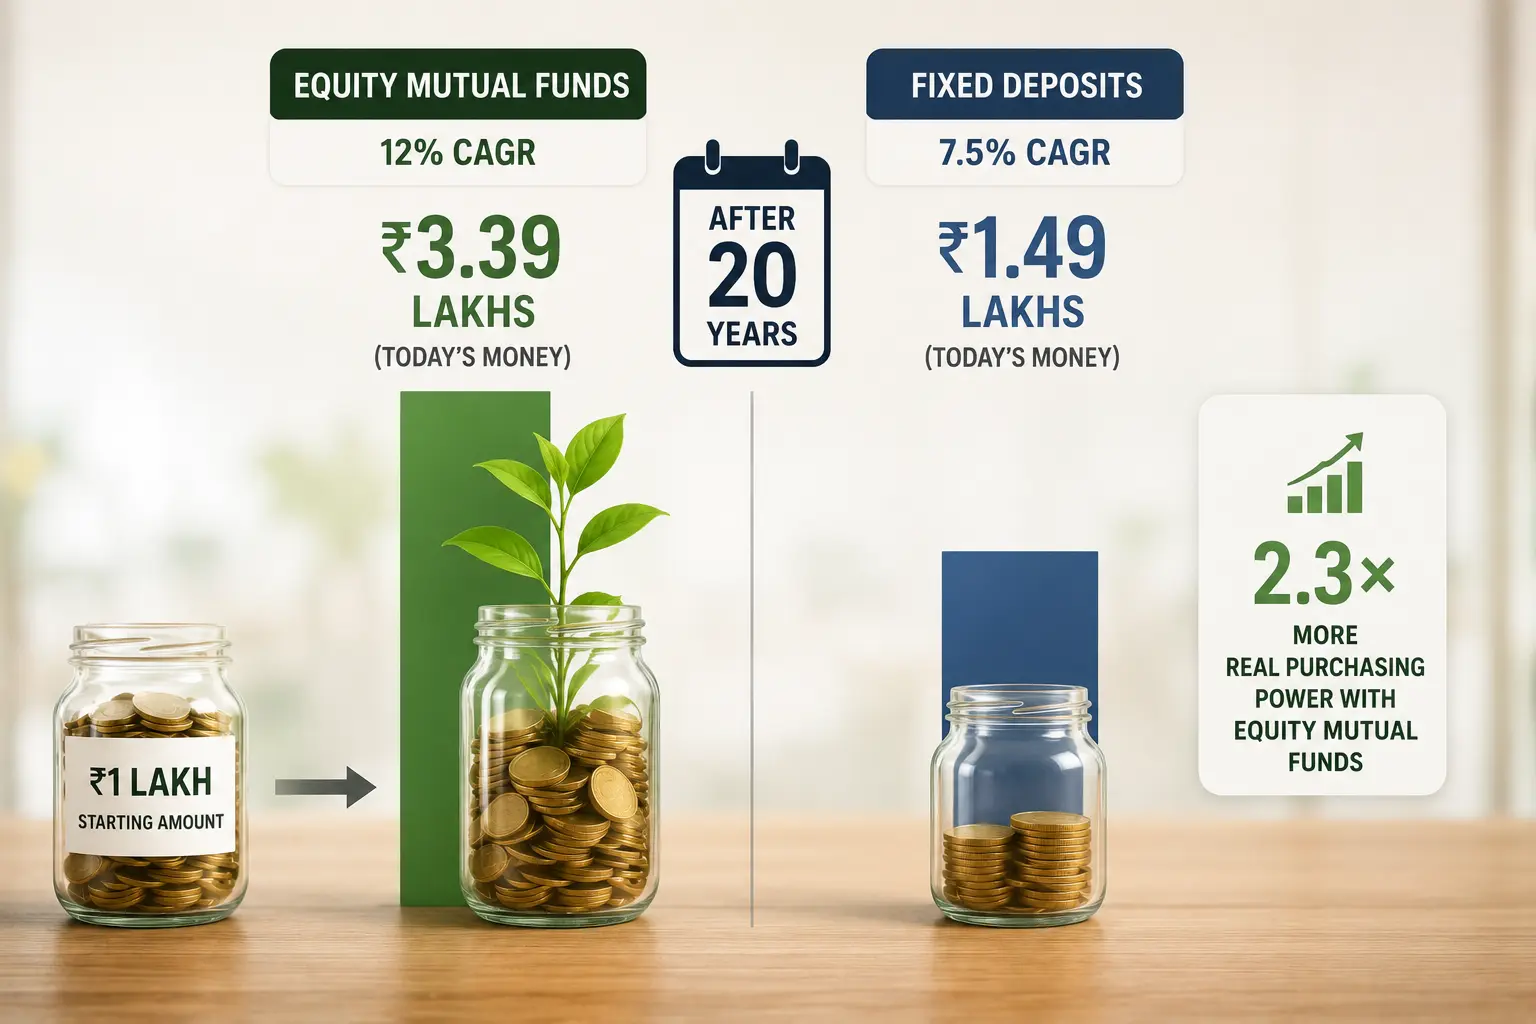
| Bank FD | 7.5% | 5.5% | ~2% | ₹4.25 lakhs | ~₹1.49 lakhs |
| Large-cap equity MF | 12% | 5.5% | ~6.5% | ₹9.65 lakhs | ~₹3.39 lakhs |
In purchasing power terms, ₹1 lakh in an equity mutual fund growing at 12 percent over twenty years produces approximately 2.3 times more real wealth than the same amount in an FD at 7.5 percent. This is not a small difference. Over a working lifetime of thirty to forty years of investing, this differential compounds into dramatically different retirement outcomes.
The Tax Comparison: Where FDs Are at a Significant Disadvantage
The tax treatment of FD returns versus mutual fund returns is one of the most practically significant differences between the two instruments — and one that is often not factored into informal comparisons. It consistently disadvantages FDs for investors in higher tax brackets. For current LTCG rates, exemption limits, and the full capital gains breakdown, see the income tax basics guide.
How FD interest is taxed
Interest earned on fixed deposits is added to the investor's total income and taxed at the applicable income tax slab rate. For a person in the 30 percent tax bracket, every rupee of FD interest earns 70 paise after tax. The bank also deducts TDS at 10 percent if interest exceeds ₹40,000 per year (per bank), which must be topped up to the slab rate at filing.
The compounding impact is significant: FD returns reinvested in subsequent FDs create fresh taxable income each year. The 7.5 percent pre-tax FD return becomes approximately 5.25 percent post-tax for a 30 percent taxpayer, and approximately 6 percent post-tax for a 20 percent taxpayer.
How equity mutual fund returns are taxed
Equity mutual fund gains are taxed as capital gains, not as income. Long-term capital gains (units held more than twelve months) are taxed at 12.5 percent above a ₹1.25 lakh annual exemption (unchanged since Budget 2024; no further changes in Budget 2025 or 2026). Short-term capital gains (held twelve months or less) are taxed at 20 percent.
The critical structural advantage: unrealised gains in a mutual fund are not taxed annually. If you invest in an equity mutual fund and do not redeem for ten years, you pay no capital gains tax during those ten years regardless of how much the NAV has grown. Tax is triggered only by redemption. This allows the entire pre-tax return to compound within the fund throughout the holding period, with tax due only at the end. For FDs, tax is paid on interest every year, reducing the compounding base.
| Scenario | FD at 7.5% | Equity MF at 12% CAGR |
|---|---|---|
| Pre-tax return | 7.5% p.a. | 12% p.a. (illustrative long-run) |
| Tax treatment | Interest taxed as income at slab rate each year | LTCG at 12.5% only on redemption; ₹1.25L annual exemption |
| Post-tax return (30% slab) | ~5.25% p.a. | ~10.5% effective (12% compounding, 12.5% tax at redemption after 10 yrs) |
| Post-tax return (20% slab) | ~6.0% p.a. | ~10.7% effective |
| Post-tax return (nil / 5% slab) | ~7.1% p.a. | ~11.2% effective (LTCG exemption covers many small investors) |
| ₹1 lakh after 10 years (post-tax, 30% bracket) | ~₹1.67 lakhs | ~₹2.72 lakhs |
| ₹1 lakh after 20 years (post-tax, 30% bracket) | ~₹2.79 lakhs | ~₹7.41 lakhs |
The Risk Comparison: What 'Risk' Actually Means for Each Instrument
The risk of fixed deposits and mutual funds is qualitatively different, and conflating them is one of the most common sources of confusion in personal finance.
FD risk: credit risk, not market risk
Fixed deposits do not carry market risk. The principal and the promised interest are contractually guaranteed. The risk in an FD is credit risk: the possibility that the issuing institution fails to honour the contract. For deposits in scheduled commercial banks up to ₹5 lakhs, DICGC insurance makes this risk effectively negligible. For deposits above ₹5 lakhs, or deposits in cooperative banks, NBFCs, or corporate FDs, the credit risk is real and has materialised in specific failures (PMC Bank, DHFL, IL&FS) in the Indian market in recent years.
The second risk is reinvestment risk: when the FD matures, prevailing interest rates may be lower than the rate at which it was issued. If you locked in a 7.5 percent FD in 2023 and it matures in 2026 when bank rates are 6 percent, your new FD earns at the lower rate. This affected large cohorts of FD investors during the low-interest-rate environment of 2020 to 2022.
Mutual fund risk: market risk and volatility
Mutual funds carry market risk: the NAV can fall. The degree of market risk depends entirely on the type of fund. Liquid and overnight funds carry near-zero market risk. Short-duration debt funds carry modest interest rate and credit risk. Equity mutual funds carry significant short-term price volatility: in any given year, equity markets can fall 20 to 40 percent.
The key distinction: equity market volatility is temporary; FD credit risk materialisation (when an institution fails) is not temporary. A bank failure does not recover. An equity market decline does, historically and eventually. The time horizon is what determines whether equity mutual fund risk is manageable or not.
Risk by investment horizon
| Investment horizon | FD risk profile | Equity MF risk profile | Which is more appropriate |
|---|---|---|---|
| Less than 1 year | Very low (with scheduled bank); near-zero if within DICGC limit | Moderate to high; short-term equity movements can produce significant loss | FD or liquid debt mutual fund |
| 1–3 years | Low; reinvestment risk at maturity | Moderate; equity can be significantly below entry price over 1–3 years | FD or short-to-medium duration debt MF; equity MF only for the portion you can afford not to need |
| 3–5 years | Low; inflation erosion meaningful over this period | Moderate; still possible to be below entry over any 5-year period though less common | Balanced/hybrid mutual fund; FD for the portion that cannot tolerate any loss |
| 5–10 years | Low; inflation erosion increasingly significant; real return modest | Low to moderate; 10-year periods almost always positive in Indian equity history | Equity MF for a significant portion; FD for the stable/guaranteed portion |
| 10+ years | Low nominal risk; high inflation erosion risk | Low on a 10+ year basis historically; short-term volatility irrelevant over this horizon | Equity MF strongly preferred; FD only for capital that genuinely cannot risk any fluctuation |
The Liquidity Comparison
FD liquidity
Fixed deposits can be broken before maturity in most cases, but at a penalty: the interest paid is reduced to the rate applicable at the tenure for which the FD was actually held, plus a penalty charge of 0.5 to 1 percent in most banks. The effective cost of premature FD withdrawal is typically 1 to 1.5 percent of the interest otherwise due.
Loan against FD is an alternative: banks typically offer loans against FDs at 0.5 to 1 percent above the FD rate, allowing liquidity without breaking the deposit. This is useful when liquidity is needed temporarily without permanently forgoing the FD return.
Mutual fund liquidity
Open-ended mutual funds offer T+1 to T+3 redemption cycles. Liquid funds and overnight funds provide same-day or T+1 credit. Equity funds typically credit proceeds within two to three business days. There are no penalty charges for redemption except exit loads (typically 1 percent within one year for equity funds; nil after one year for most funds).
| Liquidity dimension | Fixed deposits | Equity mutual funds | Liquid / debt mutual funds |
|---|---|---|---|
| Time to access funds | T+1 to T+3 days (premature closure process) | T+2 to T+3 business days | T+0 to T+1 (liquid funds same day up to ₹50K) |
| Penalty for early access | 0.5–1.5% interest reduction; varies by bank | Exit load of 1% if within 1 year; nil after 1 year for most equity funds | Nil (liquid and overnight funds typically have no exit load after 7 days) |
| Partial withdrawal | Must close full FD or use sweep account; some banks allow partial | Any amount, any time (above minimum balance) | Any amount, any time |
| Lock-in | None except for tax-saving (5-year) FD under Section 80C | ELSS only (3 years per instalment); all other funds freely redeemable | None |
When FDs Are the Right Answer
The mutual fund advocacy tendency to frame FDs as an inferior product across the board misrepresents both the instrument and the situations for which it is genuinely appropriate.
- Emergency fund. Emergency money must be completely safe and immediately accessible. It would be counterproductive to need it during a market crash and find it 30 percent below its value. Keep emergency funds in savings accounts, liquid mutual funds, or FDs — not in equity. See the emergency fund guide for sizing guidance.
- Short-to-medium goals with a defined date. Saving for a wedding in eighteen months, a home down payment in two years, or any planned expenditure with a fixed date. FDs or short-duration debt mutual funds remove market timing risk.
- Capital preservation for older or risk-intolerant investors. A retired person living primarily on investment income cannot absorb a 30 percent portfolio decline without affecting their living standard.
- Very low risk tolerance. A person who will sell during a market decline is better served by an FD at 7 percent than by an equity fund at 12 percent average, because their actual realised return from equity will be lower than the fund's return due to panic selling.
- Long-horizon wealth building (5+ years, ideally 10+). For wealth creation over long time horizons, equity mutual funds have historically produced returns that substantially exceed FDs in nominal, real, and after-tax terms. The compounding differential over twenty to thirty years is too large to ignore. Start a SIP early — even ₹500 a month compounds meaningfully.
- Retirement savings. The retirement corpus needs to grow significantly in real terms and then provide income for twenty-five to thirty years. At FD returns, the inflation erosion over this period is severe.
- Tax efficiency for higher-bracket investors. For investors in the 20 or 30 percent income tax bracket, the LTCG tax treatment of equity mutual fund gains is dramatically more favourable than FD interest taxed at slab rate.
- Beating inflation over time. Equity mutual funds, over horizons long enough to smooth out market cycles, have consistently provided real returns of 5 to 8 percent above inflation in India. FDs provide only ~2% real return at current rates. To understand your fund options, see index funds vs active funds.
The Head-to-Head Summary
| Dimension | Fixed Deposits | Equity Mutual Funds | Winner |
|---|---|---|---|
| Capital safety | Guaranteed up to ₹5L (DICGC); very high safety | No guarantee; NAV can fall; portfolio diversification reduces single-security risk | FD for capital safety |
| Short-term returns (under 1 year) | Predictable 6.5–7.5%; no volatility | Unpredictable; can be significantly negative | FD for short horizons |
| Long-term returns (10+ years) | 6.5–7.5% nominal; historically consistent | 10–14% nominal historically; significant annual variability but strong long-run record | Equity MF for long horizons |
| Inflation protection | Weak to moderate; real return ~2% at current rates | Strong; real returns historically 5–8% above inflation | Equity MF |
| Tax efficiency (30% bracket) | Interest taxed at 30% each year; effective ~5.25% | LTCG at 12.5% only on redemption; tax-deferred compounding; effective ~10.5% | Equity MF significantly |
| Liquidity | Moderate; premature withdrawal possible with penalty | High; T+2 to T+3; no penalty after 1 year for most funds | Broadly similar; edge to MF for no-penalty liquidity |
| Volatility / predictability | Zero volatility; completely predictable return | High short-term volatility; lower over long horizons | FD for those who need predictable returns |
| Ease of understanding | Simple; anyone can understand it | Requires learning; fund selection, NAV concepts, expense ratios | FD for simplicity |
| Emergency fund use | Appropriate; safe and predictable | Inappropriate for equity; liquid debt MF is an alternative | FD (or liquid MF) |
| Retirement savings (30-year horizon) | Insufficient real return; inflation erodes corpus meaningfully | Strong historical record; appropriate with managed risk | Equity MF strongly |
The Real Answer: Both, in the Right Proportions
The FD vs mutual fund framing implies a choice between two alternatives. For most investors with multiple financial goals, the answer is to use both instruments for the purposes each is suited to. A sensible financial structure for a working-age investor — and the framework to track whether it is working — is part of your overall net worth picture.
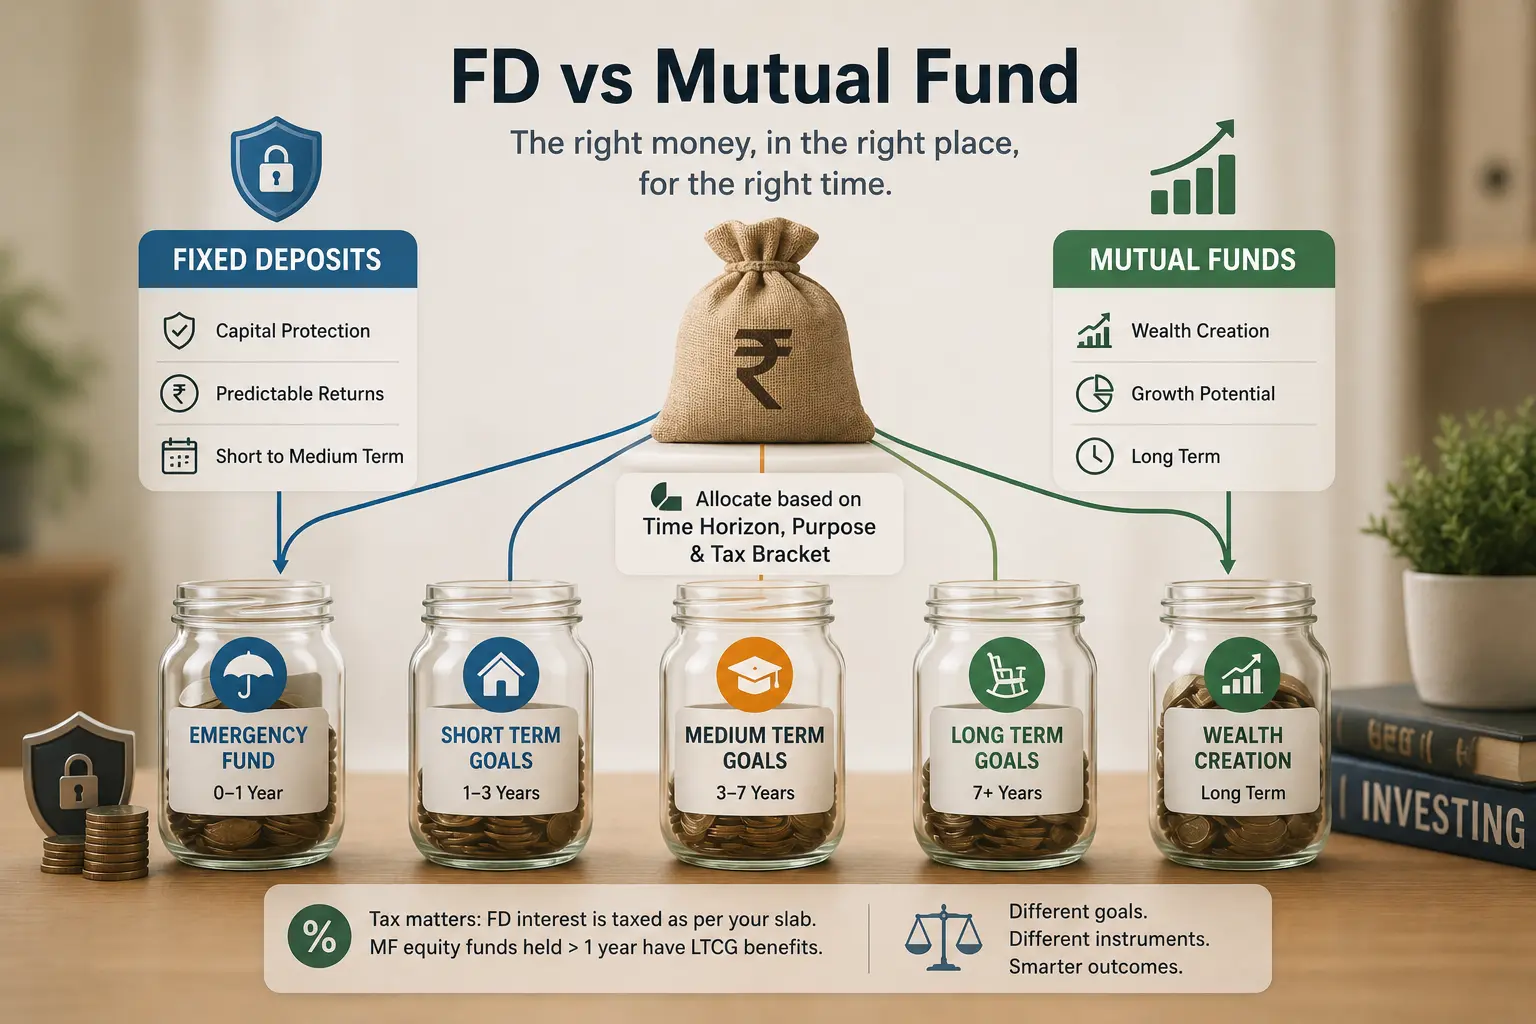
- Emergency fund (3–6 months expenses): Liquid mutual funds or bank FD — completely safe and accessible
- Short-term goals (under 3 years): FD or short-duration debt mutual funds — capital protection with modest return
- Medium-term goals (3–5 years): Balanced/hybrid mutual funds — some equity exposure for growth with debt for stability
- Long-term goals (5+ years) and retirement: Diversified equity mutual funds; index funds — the instrument where compounding and tax efficiency produce the largest wealth over time
- Capital that cannot tolerate any loss regardless of horizon: FD — not everything belongs in equity regardless of time horizon
Common Mistakes in the FD vs Mutual Fund Decision
The Answer That Is Always Correct
Neither fixed deposits nor mutual funds are universally superior. The correct answer for any specific person depends on what the money is for, when it will be needed, how the investor is taxed, and whether the investor can genuinely tolerate the short-term fluctuations that equity investing involves.
For capital that cannot afford to lose value — ever, for any reason, at any time — FDs are the right instrument. For capital building wealth over a long horizon for a purpose that does not require a specific guaranteed sum at a specific date, equity mutual funds have a strong historical case and a significant tax efficiency advantage that matters more the longer the holding period.
The financial industry has commercial incentives to push one or the other. Mutual fund distributors earn more from equity funds than from directing clients to FDs. Banks have an interest in keeping deposits. The honest picture is that both instruments serve important and distinct roles in a well-structured financial plan — the question is not which is better in the abstract but which is right for which purpose in your specific situation.
To work through where your current savings and goals fit within this framework — and to see the post-tax return difference for your specific tax bracket and time horizon — use the FD vs Mutual Fund Decision Guide. And for a complete view of how these instruments fit within your overall financial picture, the guide to calculating your net worth shows you exactly where you stand across every asset and liability category.
If you want to structure the full financial architecture — emergency fund, insurance, debt, and then long-term investing in the right instruments — the Personal Finance Basics course walks through all of it in sequence. Free, no sign-up, structured to be actionable from the first lesson.