
Most people who have not started investing yet are not waiting because they do not want to invest. They are waiting because something is not quite right: the amount feels too small to matter, or the market looks uncertain right now, or they want to understand it better before committing. The intention is genuine. The waiting is the problem.
The mathematics of compounding has one feature that makes the waiting problem expensive in a way that feels abstract until you calculate it: the cost of delay is not linear. The first years of an investment horizon carry disproportionate weight because those are the years in which compounding has the longest time to work. Delaying by two years at the beginning of a thirty-year investment horizon costs more in final corpus than delaying by two years in the middle of it. Small amounts started early beat larger amounts started late.
This article explains how Systematic Investment Plans work as a mechanism — not as a marketing concept, but as a specific way of interacting with equity markets that addresses the two things that most reliably prevent people from investing: the question of timing (when is the right time to put money in) and the question of threshold (how much do I need to start). It explains rupee cost averaging, compounding, the tax treatment of SIP returns, and the specific calculations that make the ₹500-per-month argument concrete rather than rhetorical. If you are still working on the foundations before getting to investing, the 50/30/20 rule is a good place to start — SIPs work best as the savings portion of a deliberately structured budget.
What a SIP Actually Is
A Systematic Investment Plan is a method of investing a fixed amount in a mutual fund at regular intervals — monthly is the most common — regardless of the fund's NAV (Net Asset Value) at the time of investment. The SIP mechanism automates the investment: a standing instruction transfers a fixed sum from your bank account on the same date each month, which the fund house uses to purchase fund units at that day's NAV.
SIP is not itself an investment product. It is a mode of investment. The underlying product is a mutual fund — equity, debt, or hybrid — and the SIP is the instruction governing how capital is deployed into that fund. A lump sum investment makes a single large purchase on one day at one NAV. A SIP makes many smaller purchases on many different days at many different NAVs across the investment horizon.
The distinction matters because the mechanism produces a specific outcome that lump sum investment does not: your average purchase price over time converges toward the average market price over the investment period, rather than depending on the price on any single day. This is rupee cost averaging, and it is the primary mechanical advantage of SIP investing for most retail investors.
Rupee Cost Averaging: The Mechanism That Removes the Timing Problem
The single most paralysing question for new investors is "is now a good time to invest." The market looks high; maybe it will fall. The market has just fallen; maybe it will fall further. There is always a reason to wait for conditions that feel more clearly favourable. The inconvenient truth is that no one — not professional fund managers, not economists, not market analysts — consistently and correctly predicts short-term market movements. Waiting for the right entry point is not a strategy. It is a form of indefinite delay disguised as prudence.
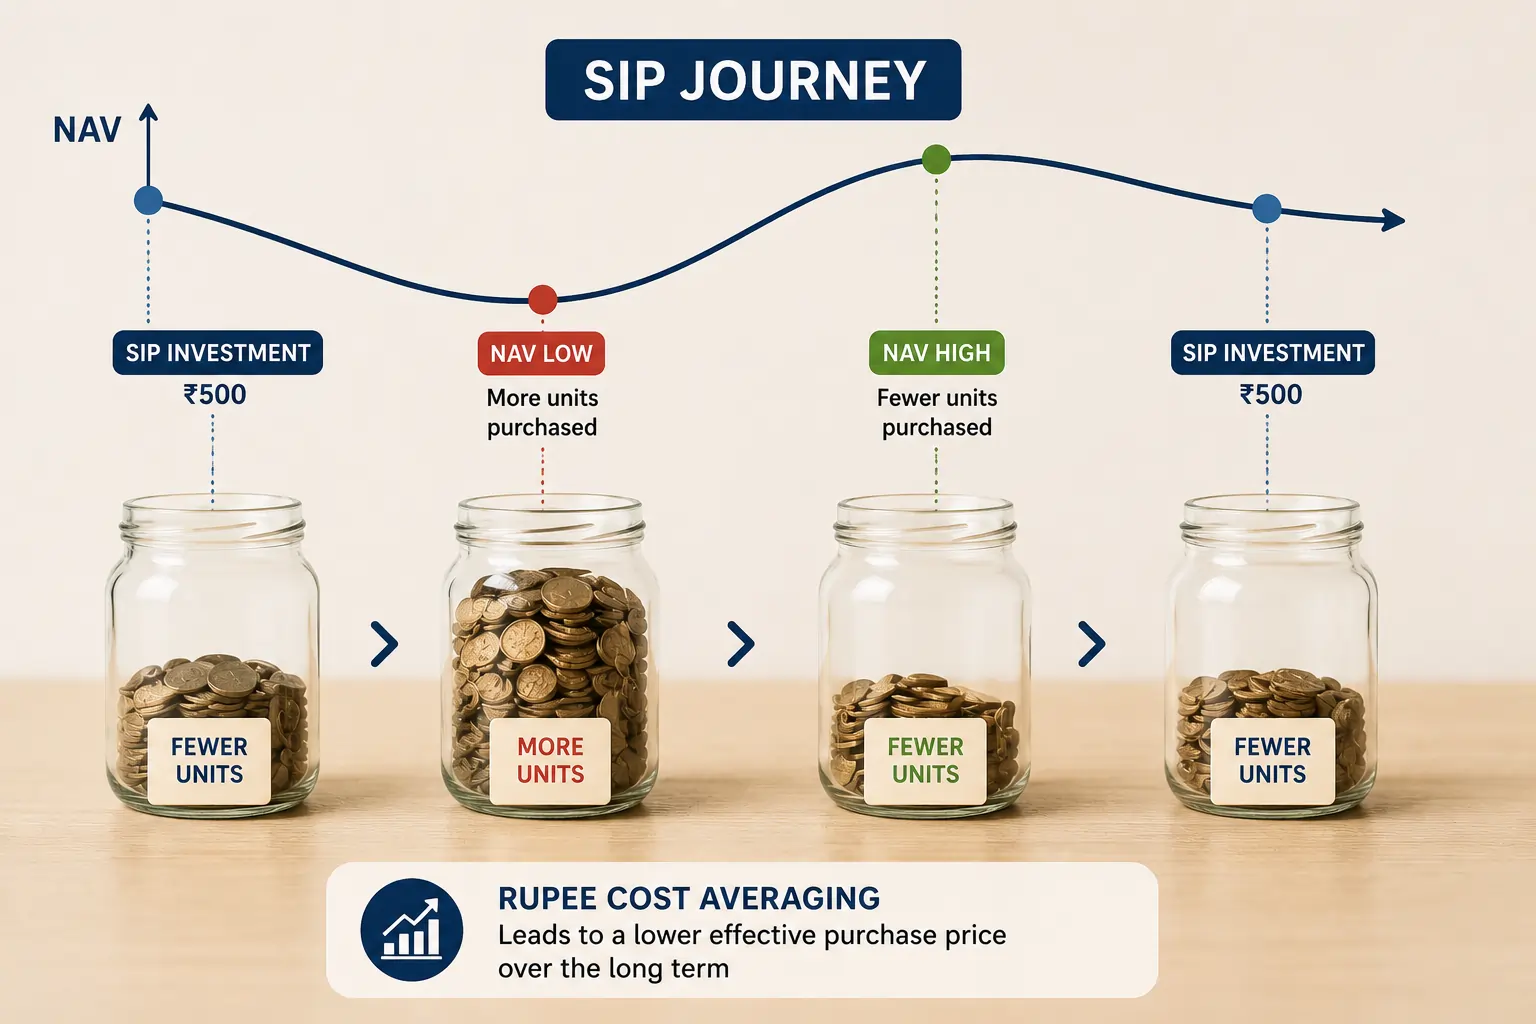
Rupee cost averaging dissolves this problem by removing the single-entry-point decision entirely. When you invest a fixed amount monthly, the number of units you purchase in any month depends on the NAV that month: when the NAV is high, your fixed amount buys fewer units; when the NAV is low, the same amount buys more units. You automatically accumulate more units when markets are down and fewer when they are up. This is the mechanical behaviour that sophisticated investors attempt to replicate through deliberate market timing — and that SIP investors achieve automatically.
A worked example of rupee cost averaging
| Month | Fixed SIP amount (₹) | NAV (₹ per unit) | Units purchased |
|---|---|---|---|
| January | 2,000 | 100 | 20.00 |
| February | 2,000 | 90 | 22.22 |
| March | 2,000 | 80 | 25.00 |
| April | 2,000 | 85 | 23.53 |
| May | 2,000 | 95 | 21.05 |
| June | 2,000 | 105 | 19.05 |
| Total invested | 12,000 | — | 130.85 units |
| Average purchase NAV | — | ₹91.68 (12,000 ÷ 130.85) | — |
| Simple average of NAVs | — | ₹92.50 ((100+90+80+85+95+105) ÷ 6) | — |
The worked example shows a key property: the average purchase price through a SIP (₹91.68) is lower than the simple average of the NAVs across the period (₹92.50), because the fixed investment amount bought proportionally more units when the price was lower. This compounds meaningfully over longer investment horizons and through larger market fluctuations.
More importantly: the investor who invested ₹12,000 as a lump sum in January purchased units at ₹100. After six months, if the NAV is ₹105, their return is 5 percent. The SIP investor, at the same ending NAV of ₹105, holds 130.85 units worth ₹13,739 against a total investment of ₹12,000 — a return of 14.5 percent. The same market, the same ending price, different outcomes because of when capital was deployed.
Compounding: Why Time Is the Most Important Variable
Compounding is the process by which investment returns generate their own returns. In the first year, you earn returns on your principal. In the second year, you earn returns on your principal plus the first year's returns. In the tenth year, you earn returns on a substantially larger base that includes a decade of accumulated growth. The power of this is not obvious until you run the numbers at different time horizons — the full mechanics, formula, and worked examples are covered in detail separately, in any currency.
The ₹500-per-month calculation
| Monthly SIP (₹) | Duration | Total invested (₹) | Corpus at 12% CAGR (₹) | Returns generated (₹) |
|---|---|---|---|---|
| 500 | 10 years | 60,000 | 1,16,170 | 56,170 |
| 500 | 15 years | 90,000 | 2,51,540 | 1,61,540 |
| 500 | 20 years | 1,20,000 | 4,99,574 | 3,79,574 |
| 500 | 25 years | 1,50,000 | 9,46,932 | 7,96,932 |
| 500 | 30 years | 1,80,000 | 17,64,974 | 15,84,974 |
At thirty years, ₹500 per month grows to nearly ₹18 lakhs. The total amount invested is ₹1.8 lakhs — the returns generated (₹15.8 lakhs) are nearly nine times the capital invested. The return figure is not evenly distributed across the thirty years; the majority of corpus growth happens in the final third of the investment period as compounding accelerates on the larger base. The 12 percent CAGR used is a commonly used proxy for long-term Indian equity mutual fund returns, derived from historical performance of broad market equity funds over fifteen to twenty year periods. It is not guaranteed, but it is a reasonable long-run central estimate. Run your own numbers with the SIP calculator.
The cost of delaying two years
| Scenario | Monthly SIP (₹) | Start age | End age | Total invested (₹) | Corpus at 12% CAGR (₹) |
|---|---|---|---|---|---|
| Start at 25, invest until 55 | 5,000 | 25 | 55 | 18,00,000 | 1,76,49,740 |
| Start at 27, invest until 55 | 5,000 | 27 | 55 | 16,80,000 | 1,39,06,430 |
| Difference from 2-year delay | Invested ₹1,20,000 less | Lost ₹37,43,310 | |||
The two-year delay invested ₹1.2 lakhs less in total but produced a corpus ₹37 lakhs smaller. Each rupee of capital invested in those two early years generated roughly ₹31 in corpus versus roughly ₹12 for capital invested in the later years. This is the specific, calculable cost of waiting that the abstract statement "start early" is trying to convey.
Why ₹500 Is a Real Starting Point, Not a Token One
The common objection to small SIP amounts is that they are too small to matter. ₹500 a month is less than most people spend on a single restaurant meal. Surely it cannot build meaningful wealth. The objection fails on the mathematics but more importantly it misunderstands what ₹500 a month is doing.
At the level of outcomes, ₹500 a month for thirty years at 12 percent CAGR produces approximately ₹17.6 lakhs. That is not trivial for most Indian households. But the corpus size is not the primary argument for ₹500. The primary argument is what ₹500 builds that cannot be built by waiting.
The habit and identity argument
An investment habit is a behaviour that becomes automatic over time, requiring less decision-making and less motivational energy to sustain once established. A ₹500 SIP started today builds the infrastructure of investing: the KYC, the account, the standing instruction, the monthly experience of watching a portfolio, the familiarity with NAV movements and fund statements, and the psychological identity of someone who invests rather than someone who intends to invest.
The person who starts with ₹500 today and increases to ₹5,000 in two years has built the habit and the infrastructure during the lower-amount period. The person who waits until they can invest ₹5,000 starts from zero when the higher amount becomes available — building the habit at higher stakes and without the benefit of compounding on the months passed during the waiting period. This parallels the broader financial principle at the centre of a one-page financial plan: clarity about the order of operations in your finances produces better outcomes than waiting for everything to be optimal simultaneously.
The step-up SIP: the architecture for growing the amount
The most practical argument for starting small is the step-up SIP: a SIP with a pre-set annual increase in the investment amount. Most major fund platforms offer step-up SIPs as a standard feature. You specify the monthly starting amount and an annual step-up — either a fixed rupee amount or a percentage increase — and the monthly investment increases automatically each year.
| Scenario | Starting SIP (₹/month) | Annual step-up | SIP after 5 yrs | SIP after 10 yrs | Corpus at 20 yrs (12% CAGR) |
|---|---|---|---|---|---|
| Start now, step up 10% annually | 500 | 10% per year | ₹805 | ₹1,297 | ~₹19,80,000 |
| Wait 2 years, start at flat ₹2,000 | 2,000 | None | ₹2,000 | ₹2,000 | ~₹19,97,000 |
| Start now, step up 15% annually | 500 | 15% per year | ₹1,007 | ₹2,023 | ~₹25,40,000 |
| Start now at flat ₹500 for 20 years | 500 | None | ₹500 | ₹500 | ~₹4,99,574 |
The step-up scenario makes the ₹500 starting point genuinely competitive. Starting with ₹500 and stepping up 10 percent annually for twenty years produces a corpus approximately equivalent to starting with ₹2,000 flat two years later. The early start years offset the lower initial amount. The step-up ensures the SIP keeps pace with income growth rather than remaining fixed at the starting level.

How SIPs Are Taxed: What You Need to Know
Tax treatment of SIP returns in India is governed by mutual fund taxation rules, which differ from the popular misconception that all SIP returns are long-term capital gains. The holding period for each SIP instalment is calculated independently from the date that instalment was invested, not from the date the SIP was started. For a full breakdown of the current LTCG rates, exemption limits, and current LTCG rates and exemption limits, see the income tax basics guide for salaried Indians.
Equity mutual fund SIP taxation
For equity mutual funds (including ELSS), units are classified as long-term if held for more than twelve months from the date of purchase. Since each SIP instalment is a separate purchase, units from a SIP instalment become long-term capital assets twelve months after that specific instalment date.
| Capital gains type | Holding period | Tax rate (FY 2026-27) | Annual exemption |
|---|---|---|---|
| Short-term capital gains (STCG) | Less than 12 months from purchase | 20% (increased from 15% in Budget 2024) | None |
| Long-term capital gains (LTCG) | More than 12 months from purchase | 12.5% (increased from 10% in Budget 2024) | ₹1.25 lakh per financial year (increased from ₹1 lakh) |
The practical implication: when you redeem units from a long-running SIP, gains on units purchased more than twelve months ago are taxed as LTCG (12.5 percent above the ₹1.25 lakh annual exemption). Units purchased within the last twelve months are STCG (20 percent). A systematic withdrawal from a long-running SIP will typically have most of its units qualifying as LTCG, with only the most recent twelve months' instalments potentially classified as STCG.
ELSS: the tax-saving SIP
Equity Linked Savings Schemes (ELSS) are equity mutual funds with a three-year lock-in period per SIP instalment that qualify for tax deduction under Section 80C of the Income Tax Act, up to ₹1.5 lakh per financial year. This means an ELSS SIP of ₹12,500 per month (₹1.5 lakh annually) is tax-deductible, reducing taxable income by that amount.
ELSS has the shortest lock-in period among 80C instruments — PPF is 15 years, NSC is 5 years, tax-saving FDs are 5 years — and offers equity market growth alongside the tax benefit. For investors in the 20 or 30 percent tax brackets, the tax saving alone on ₹1.5 lakh per year is ₹30,000 to ₹45,000, an effective reduction in the cost of investing. This is worth factoring into your overall financial plan early, as it integrates tax efficiency with long-term wealth building.
How to Actually Start: The Mechanics
Step 1: Complete KYC
All mutual fund investments in India require KYC (Know Your Customer) verification. The process is now entirely online for most investors. You will need: PAN card, Aadhaar-linked mobile number, and a bank account. KYC can be completed through any SEBI-registered KYC Registration Agency (KRA) — the major ones are CAMS (camskra.com), NSDL, and CDSL. Most mutual fund apps and platforms facilitate KYC as part of their onboarding flow.
Step 2: Choose between direct plans and regular plans
Every mutual fund scheme is available in two variants: regular plans (which include a distributor commission in the expense ratio) and direct plans (which do not). Direct plans have a lower expense ratio than regular plans for the same fund.
The difference in expense ratio between direct and regular plans is typically 0.5 to 1.5 percent annually. Over twenty years, a 1 percent lower annual cost on an investment at 12 percent CAGR produces approximately 22 percent more corpus. Choosing direct plans is a zero-effort improvement that compounds silently in your favour throughout the investment. Direct plans are available through AMC websites directly, CAMS and KFintech portals, and platforms like Zerodha Coin, Kuvera, and Groww (direct option).
Step 3: Choose a fund category appropriate for the time horizon
| Investment horizon | Recommended fund category | Risk level | What to look for |
|---|---|---|---|
| Less than 1 year | Liquid funds, overnight funds, ultra-short duration funds | Low | Stable NAV, high liquidity, low credit risk; not equity |
| 1–3 years | Short duration debt funds, arbitrage funds, conservative hybrid funds | Low to moderate | Limited interest rate risk; some equity for arbitrage funds |
| 3–5 years | Balanced advantage funds, aggressive hybrid funds | Moderate | Dynamic equity allocation; some downside protection |
| 5–10 years | Large cap equity funds, large and midcap funds, index funds (Nifty 50, Nifty 100) | Moderate to high | Well-diversified equity; low-cost index funds are a strong choice |
| 10+ years | Diversified equity funds: flexi cap, multi cap, large and midcap; index funds | High | Broad equity exposure; time horizon sufficient to ride out market cycles |
| Tax saving (3-year lock-in) | ELSS funds | High (equity) | Combines Section 80C tax benefit with equity exposure; three-year lock-in per instalment |
For most first-time SIP investors with a long horizon and without a specific view on fund selection, a low-cost index fund tracking the Nifty 50 or Nifty Next 50 is a defensible starting choice. Index funds have lower expense ratios than actively managed funds, are transparent in their holdings, and have a reliable evidence base showing they outperform most actively managed funds over long periods when costs are accounted for. The fund selection debate is worth engaging with as knowledge grows; it should not be a reason to delay starting.
Step 4: Set up the standing instruction
Once the fund and the amount are chosen, setting up the SIP is a five-minute process on any major platform. You choose the fund, enter the monthly amount, select the SIP date, link your bank account, and authorise the standing instruction via NACH (National Automated Clearing House) mandate — a one-time bank authorisation that allows the fund to debit the SIP amount each month without repeated manual intervention.
Choose the SIP date to fall one to two days after your salary credit date. This ensures the investment amount is available in your account when the debit occurs and implements the pay-yourself-first principle: the SIP amount is invested before it can be spent. This is the same logic behind automating savings that applies to understanding your real spending patterns — systems work better than willpower, and a standing instruction is a system.
The Most Important Decision Is the First One
Most of what needs to be decided to start a SIP is not actually difficult. KYC is a one-time online process. Fund selection for a first SIP does not require extensive research — a low-cost index fund is a good default. The amount can be as low as ₹100 on some platforms. The standing instruction takes five minutes to set up. The total barrier to starting is not high.
What is high is the barrier of the imagined starting point: the version of investing that requires market timing, fund expertise, a meaningful amount, and perfect conditions. That version does not exist. The actual starting point requires a PAN card, a bank account, a smartphone or computer, and a decision. The tendency to keep waiting for that perfect moment is not a discipline problem — it is present bias, a well-documented pattern covered in the psychology of money, and it is exactly why automating the standing instruction matters more than willpower.
The specific cost of delay has been quantified in this article. The two years lost waiting for a better time or a larger amount produce a corpus shortfall that the subsequent larger investment cannot fully recover. Start with whatever is actually available, in whatever amount is genuinely affordable, and allow the mechanism to do what the mechanism does: accumulate, average, and compound over time.
Once your core SIP is running, a reasonable next question is what else belongs in a diversified portfolio alongside equity — whether gold has a place in your portfolio covers the honest case for and against a small allocation.
If you want to place SIP investing within the full architecture of personal finance — emergency fund, insurance, debt, and then investing — the Personal Finance Basics course walks through all of it in sequence. Free, no sign-up, structured to be actionable.
To see the impact of your SIP habit on your overall financial picture, calculating your net worth periodically is the clearest measure. The guide to how to calculate your net worth covers every asset category — including how to value mutual fund holdings, EPF, and PPF — and shows how to track growth year over year.
If you are still weighing equity SIPs against keeping money in a fixed deposit, the article on mutual funds vs fixed deposits makes the comparison honestly — after-tax, after-inflation, and by time horizon — so you can decide what the right instrument is for each specific pool of money.