Before a coach can help a client change, they need a clear picture of where the client is starting from. Dietary assessment — food diaries, 24-hour recalls and questionnaires — shows eating patterns, but every method has errors, especially underreporting. Body measurements such as BMI, waist circumference and body-fat testing show body size and composition, but each has limits too. No single number tells the whole story: use simple methods consistently, look at trends over time, and refer medical tests and diagnosis to a doctor.
Section 3 covered how to help clients change. Section 4 turns to the practical tools of nutrition coaching — starting with how to assess what a client eats now, and how to measure and track changes in their body.
Free on YouTube Subscribe to get every lesson video in this course SubscribeDietary Assessment Methods
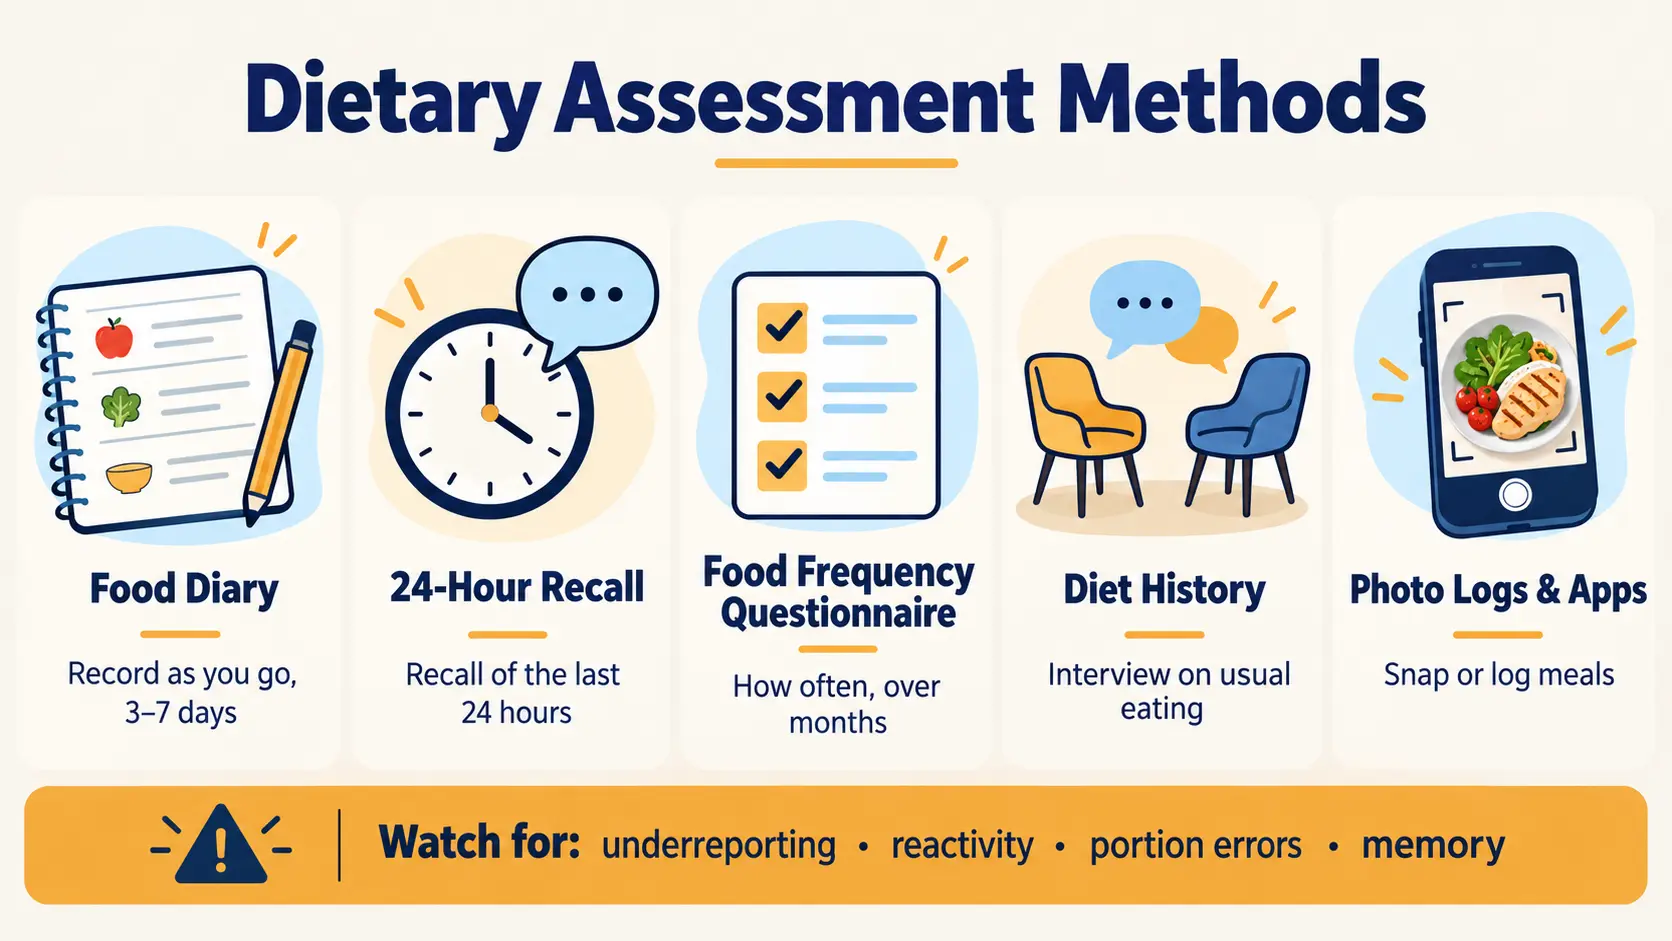
Dietary assessment means collecting information about what, when, how much and why a person eats. It gives the coach and client a starting point, reveals patterns, and helps choose the first goals (Lesson 17).
| Method | How it works | Strengths | Limitations |
|---|---|---|---|
| Food diary (food record) | The client writes down everything they eat and drink as they go — usually for 3–7 days, including at least one weekend day | Detailed; doesn't rely on memory; builds awareness | Time-consuming; people often eat differently because they're recording (reactivity); underreporting is common |
| 24-hour recall | The coach asks the client to recall everything eaten in the previous 24 hours, often in several "passes" | Quick; low effort for the client; doesn't change eating in advance | Relies on memory; one day may not be typical |
| Food frequency questionnaire (FFQ) | A checklist of how often the client eats certain foods over weeks or months | Shows usual long-term patterns | Less precise about amounts; depends on how well the list fits the client's foods and culture |
| Diet history | A detailed interview about usual meals, routines and past diets | Rich context — schedule, preferences, history | Takes time and skill; relies on memory |
| Photo logs and apps | The client photographs meals or logs them in an app | Convenient; photos show portions and food types | Portion estimates vary; app databases can contain errors; can feel burdensome over time |
Common errors
- UnderreportingMost people record less than they actually eat — especially snacks, drinks, cooking oils, sauces and "small bites". It is very common and usually unintentional.
- ReactivityThe act of recording changes what people eat — they may choose "better" foods or eat less while being observed.
- Portion size errorsPeople find portions hard to estimate. Hand-size guides or photos help (Lesson 19).
- Memory and atypical daysRecalls depend on memory, and a single day may not reflect a normal week.
Look for patterns, not perfect numbers
For coaching, the most useful information usually isn't a precise calorie total — it's the patterns: meal timing and skipped meals, how often vegetables, fruit and protein appear, drinks, snacking, eating out, and the context around eating (hunger, mood, who the client eats with, and where). Being non-judgemental matters here: clients report more honestly when they don't feel graded (Lesson 15).
Body Mass Index (BMI)
BMI is a simple ratio of weight to height:
BMI = weight (kg) ÷ height (m)²
For example, a person who weighs 81 kg and is 1.80 m tall: 1.80 × 1.80 = 3.24, and 81 ÷ 3.24 = 25.0.
| BMI (adults) | Category |
|---|---|
| Below 18.5 | Underweight |
| 18.5–24.9 | Healthy weight |
| 25.0–29.9 | Overweight |
| 30.0 and above | Obesity (class I 30–34.9, class II 35–39.9, class III 40+) |
These are the commonly used adult categories. Health risk can rise at lower BMIs in some populations, so some countries use lower cut-offs for Asian populations (for example, overweight from about 23). BMI categories for children and teenagers use age- and sex-specific growth charts instead.
- StrengthsQuick, free, needs only a scale and a height measure; useful for screening large groups.
- Limit 1: can't tell muscle from fatA muscular athlete can have a BMI above 25 with low body fat.
- Limit 2: ignores fat distributionFat stored around the abdomen carries more health risk than fat elsewhere — BMI can't show this.
- Limit 3: varies by age, sex and ethnicityThe same BMI can mean different body fat levels in different people.
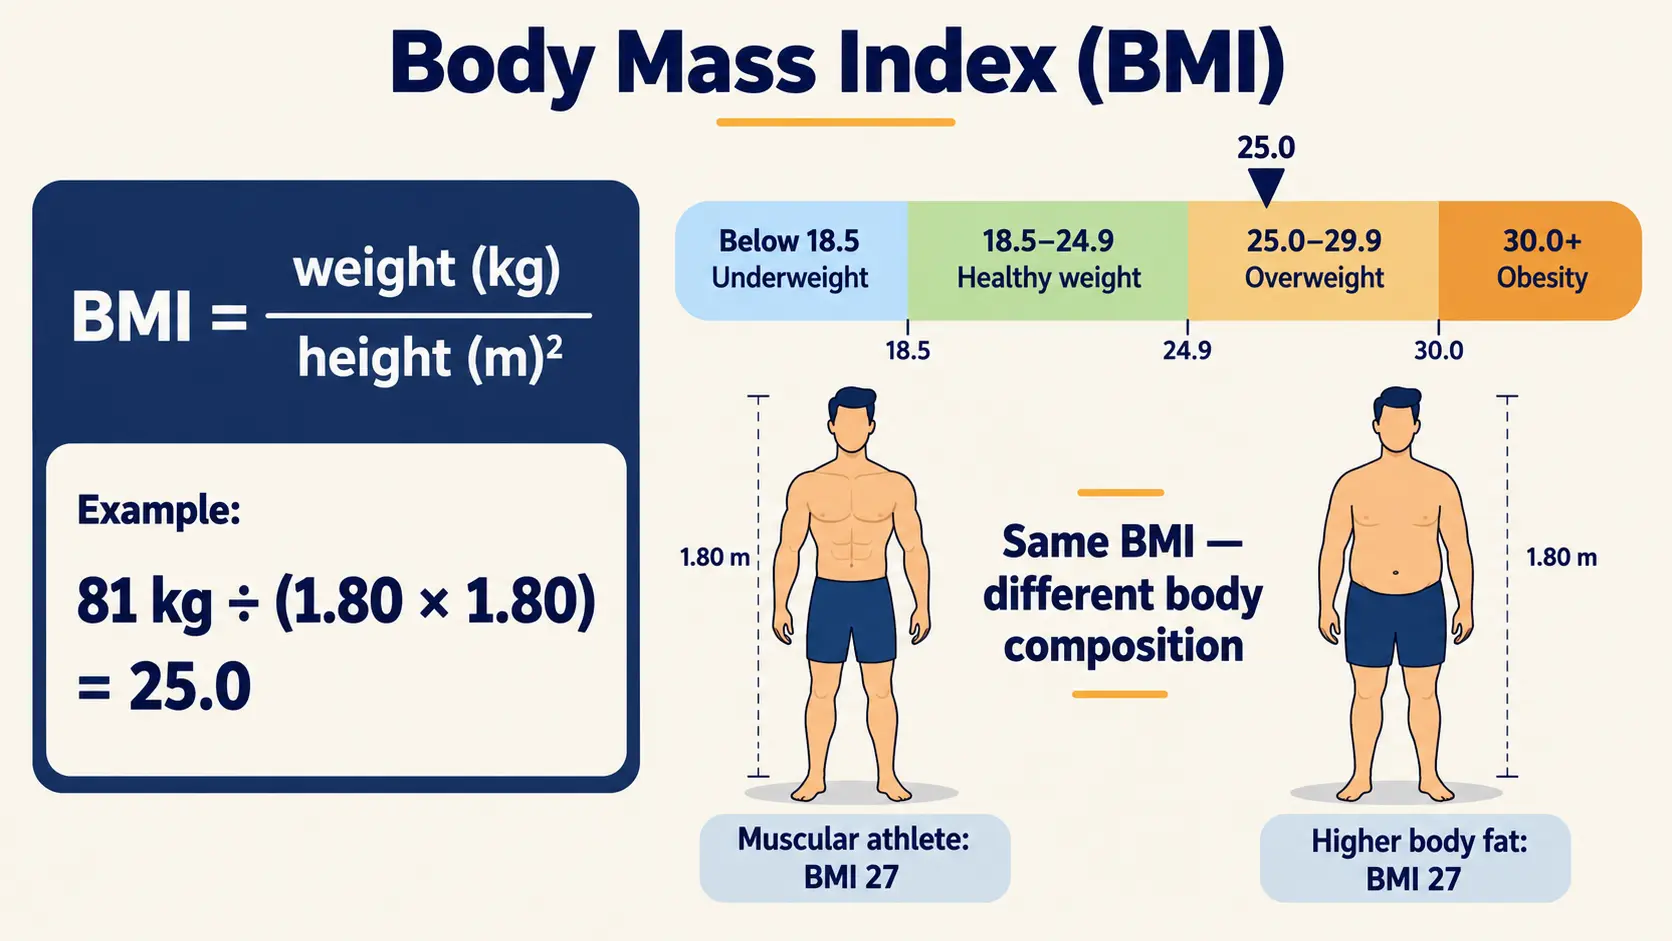
So BMI is best used as a screening tool, alongside waist measures and other information — not as a verdict on an individual's health.
Waist Measures
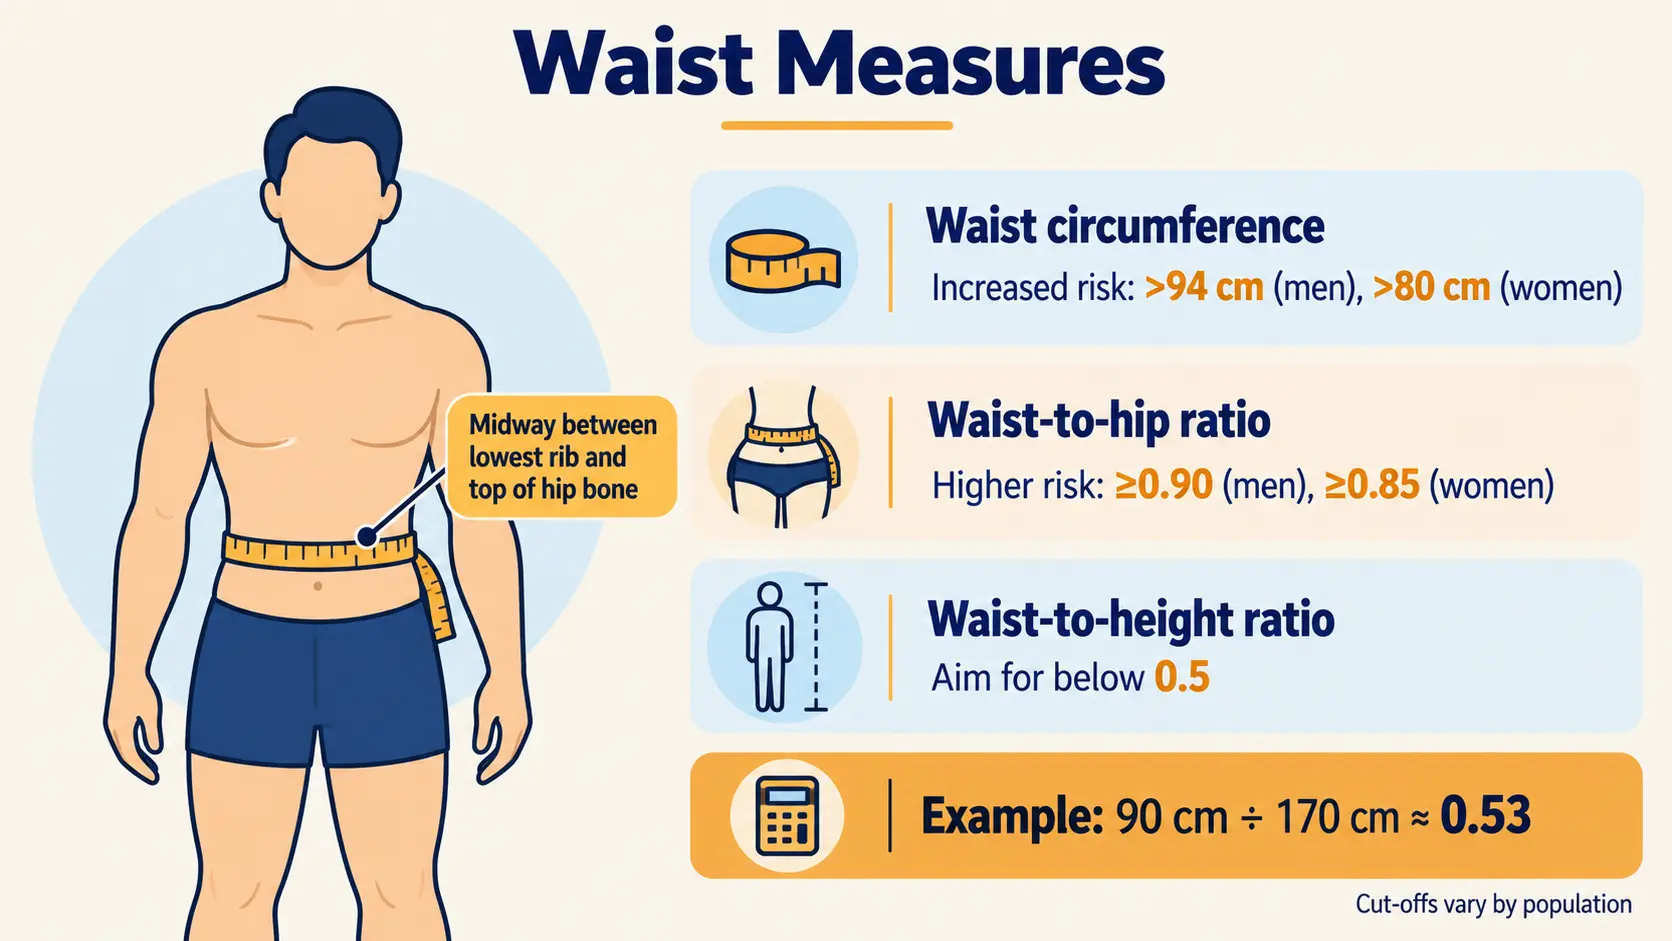
Waist measures estimate abdominal (central) fat, which is more closely linked to heart disease and type 2 diabetes than fat stored elsewhere. They're cheap, quick and good for tracking.
| Measure | How | Commonly cited guide |
|---|---|---|
| Waist circumference | Tape measure around the waist — often midway between the lowest rib and the top of the hip bone, after a normal breath out | Increased risk above about 94 cm (men) and 80 cm (women); higher risk above about 102 cm and 88 cm. Cut-offs vary by population and guideline. |
| Waist-to-hip ratio (WHR) | Waist ÷ hip (hips measured at the widest point of the buttocks) | Higher risk at about 0.90 or more (men) and 0.85 or more (women) |
| Waist-to-height ratio (WHtR) | Waist ÷ height, in the same units | Aim for below 0.5 — "keep your waist to less than half your height" |
Example: a waist of 90 cm and a height of 170 cm gives 90 ÷ 170 ≈ 0.53 — just above the 0.5 guide. Measure at the same spot, in the same way, each time: small changes in tape position change the result.
Body Composition and Body-Fat Testing
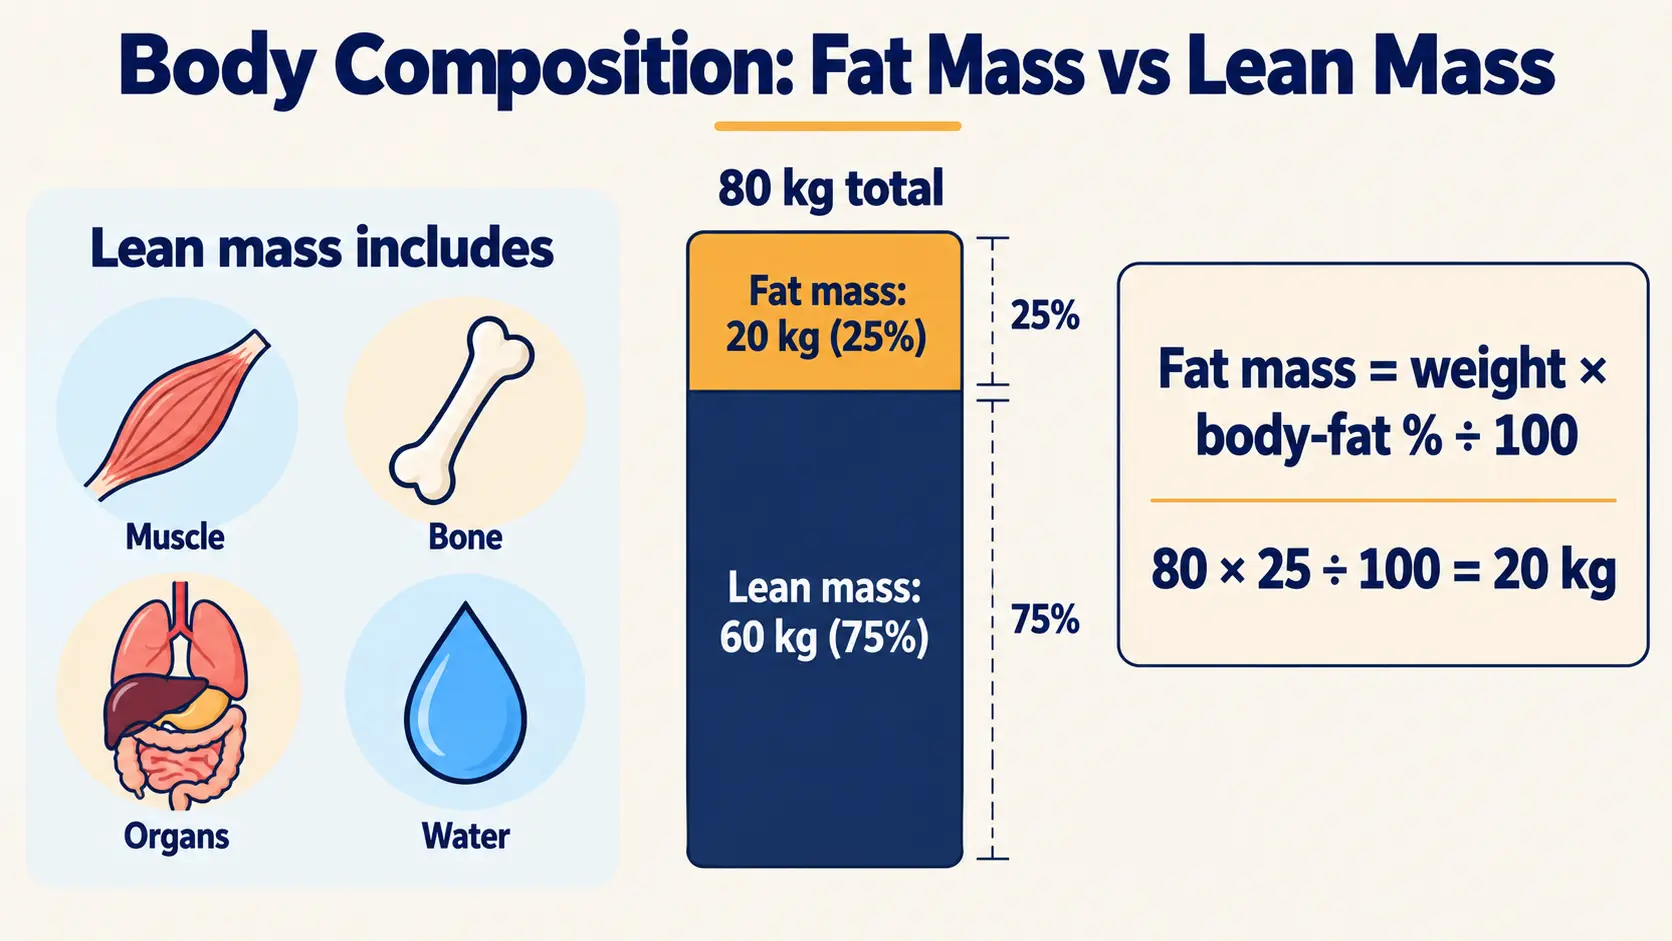
Body composition describes what the body is made of. The simplest model splits body weight into two parts: fat mass and fat-free (lean) mass — muscle, bone, organs and water. Body-fat percentage is fat mass as a share of total weight.
Fat mass = body weight × body-fat % ÷ 100. For example, 80 kg at 25% body fat = 20 kg of fat and 60 kg of lean mass.
Some fat is essential for hormones, nerves and organs — roughly 2–5% of body weight in men and 10–13% in women. Very low body fat is not a healthy goal for most people.
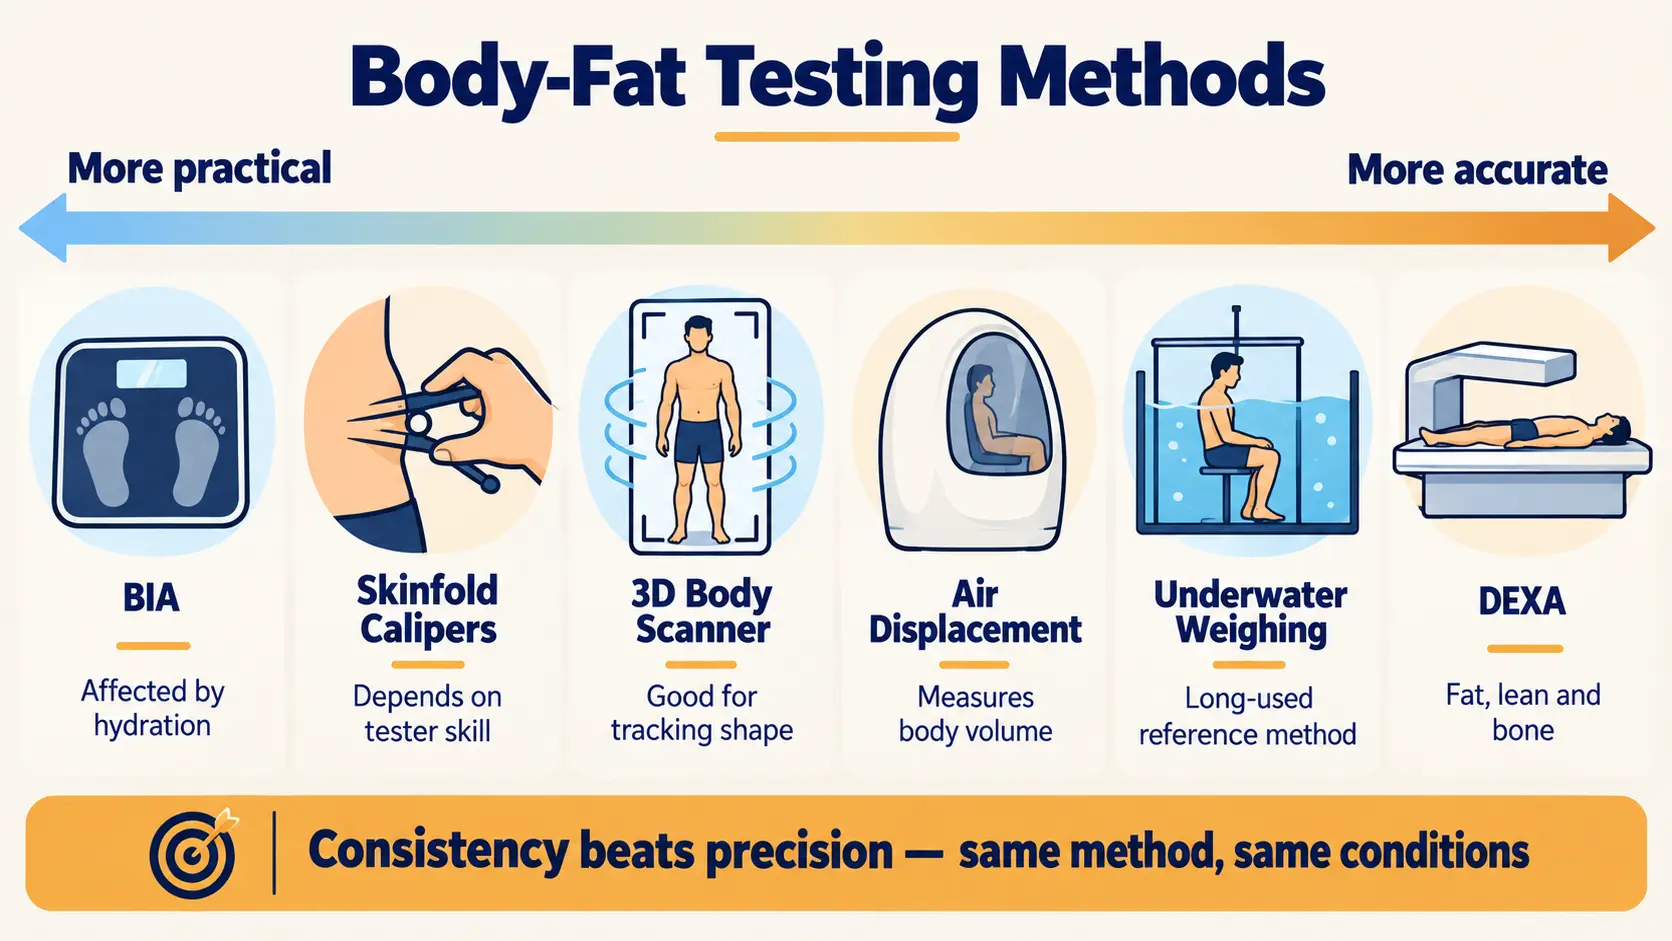
| Method | How it works | Practical notes |
|---|---|---|
| DEXA (dual-energy X-ray absorptiometry) | Low-dose X-rays separate fat, lean tissue and bone | Very accurate; shows where fat is stored and bone density; costly, needs a clinic |
| Hydrostatic (underwater) weighing | Compares weight on land and underwater — fat is less dense than lean tissue | Accurate; long used as a reference method; uncomfortable and not widely available |
| Air displacement plethysmography | Measures body volume in a sealed chamber (e.g., a "Bod Pod") | Accurate and quick; costly, specialist equipment |
| Skinfold calipers | Measures the thickness of fat under the skin at set sites; an equation estimates body fat | Cheap and portable; accuracy depends heavily on the tester's skill (typically a few percentage points of error) |
| Bioelectrical impedance (BIA) | A small electrical current passes through the body — it travels faster through water-rich lean tissue | Quick and easy (scales, handheld devices); readings shift with hydration, meals, exercise and time of day |
| 3D body scanners | Cameras map body shape and estimate circumferences and body fat | Good for tracking shape; estimates vary between devices |
No method measures body fat perfectly — even the best estimate it. For coaching, consistency beats precision: the same method, same device, same tester and same conditions each time.
Measuring and Tracking Consistently
- Body weightSame scale, same time of day (often first thing in the morning, after using the toilet, before eating), similar clothing. Look at weekly averages (Lesson 17).
- CircumferencesSame sites, same tape, relaxed posture, tape snug but not compressing the skin. Take two readings and average them.
- BIASame device, similar hydration, not straight after exercise, a large meal or a lot of fluid.
- PhotosSame lighting, distance, angles and clothing.
Body composition changes slowly, so re-measuring every 2–4 weeks is usually enough — more often just captures noise. Always get the client's consent, explain why you're measuring, and let them choose which measures they're comfortable with. Non-scale measures — energy, sleep, strength, how clothes fit — belong in the picture too.
Starting point: Farah is 1.65 m tall, weighs 70 kg and has a waist of 84 cm.
BMI: 1.65 × 1.65 = 2.72; 70 ÷ 2.72 ≈ 25.7 — just into the "overweight" range on the common scale.
Waist-to-height ratio: 84 ÷ 165 ≈ 0.51 — just above the 0.5 guide.
3-day food diary (including a Saturday): she skipped breakfast on all three days, had sweetened coffee twice each afternoon, ate vegetables at only one meal, and snacked heavily in the evening.
Coaching use: the numbers set a baseline, but the diary patterns guide the first goal. Farah chooses to add a simple breakfast on 4 workdays — and they'll re-measure her waist in 4 weeks.
For the fitness-assessment side of body composition testing, see NASM-CPT Lesson 6: Fitness Assessment.
12 questions in the style of the CNC exam. Score 70%+ to mark this lesson complete.
- Food diaries, 24-hour recalls, FFQs and diet histories each show part of the picture; underreporting and reactivity are common.
- For coaching, eating patterns and context matter more than precise calorie totals.
- BMI = kg ÷ m²; it's a screening tool that can't tell muscle from fat or show where fat is stored.
- Waist measures estimate abdominal fat; a waist-to-height ratio below 0.5 is a simple guide.
- DEXA, underwater weighing and air displacement are most accurate; skinfolds and BIA are practical but less precise.
- Measure consistently, every 2–4 weeks, with consent — and refer medical tests and diagnosis to a doctor.
Before moving to Lesson 19:
- Calculate your own BMI and waist-to-height ratio, and note one limit of each.
- Keep a 3-day food diary, including one weekend day, and list three patterns you notice.
- Practise the fat-mass calculation with two made-up clients.
- Complete the knowledge check above and review any question you missed.