Body weight changes follow energy balance — the gap between the energy you take in from food and the energy your body uses. The "energy out" side has four parts, and the biggest by far is the energy used just to keep you alive at rest. Equations can estimate how much energy someone needs, but they're a starting point, not a verdict: bodies vary, and expenditure shifts as weight and habits change.
Lesson 4 looked at why people choose the foods they do. This lesson moves into the science that underpins every nutrition recommendation a coach makes: how much energy food provides, how much the body uses, and what happens when those two numbers don't match. Expect this chapter to show up a lot on the exam — and to be one you'll want to find quickly with the book open.
Free on YouTube Subscribe to get every lesson video in this course SubscribeCalories: How Energy Is Measured
A calorie is a unit of energy. The "calories" on food labels are technically kilocalories (kcal) — the energy needed to raise the temperature of one kilogram of water by one degree Celsius. Some countries also list energy in kilojoules (kJ); 1 kcal is about 4.18 kJ. In everyday coaching, "calories" and "kcal" mean the same thing.
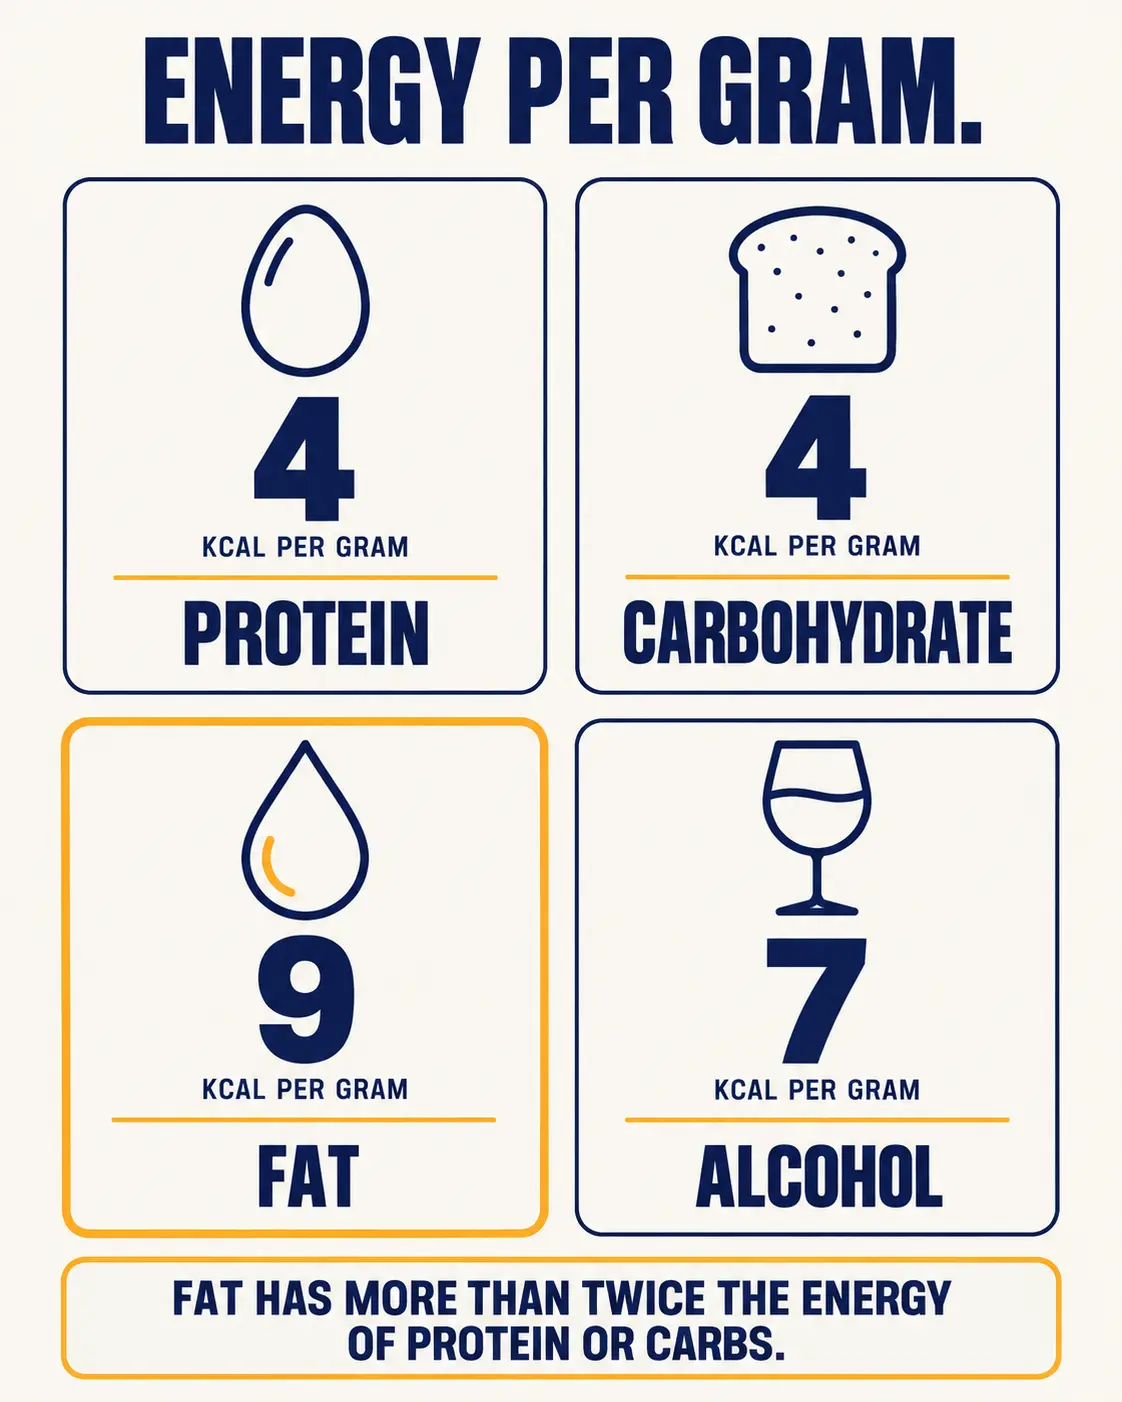
Food energy comes from the macronutrients, plus alcohol. Each provides a different amount of energy per gram — numbers worth knowing by heart, because they come up constantly in both coaching and exam questions.
| Energy source | Energy per gram | Thermic effect (share of its calories used in digestion) |
|---|---|---|
| Protein | ~4 kcal | Highest — roughly 20–30% |
| Carbohydrate | ~4 kcal | Roughly 5–10% |
| Fat | ~9 kcal | Lowest — roughly 0–3% |
| Alcohol | ~7 kcal | Provides energy but no essential nutrients (see Lesson 9) |
A quick worked example: a snack with 10 g protein, 20 g carbohydrate and 5 g fat provides about (10 × 4) + (20 × 4) + (5 × 9) = 40 + 80 + 45 = 165 kcal. Being able to run this calculation quickly saves real time on a timed exam.
Energy Balance: In, Out and the Gap Between
Energy balance compares energy intake (food and drink) with energy expenditure (everything the body does). There are three possible states:
- Positive energy balanceIntake is higher than expenditure over time. The surplus is stored, and body weight tends to rise.
- Negative energy balanceIntake is lower than expenditure over time — often called a calorie deficit. The body draws on stored energy, and body weight tends to fall.
- Neutral energy balanceIntake roughly matches expenditure. Body weight stays broadly stable — the goal during weight maintenance.
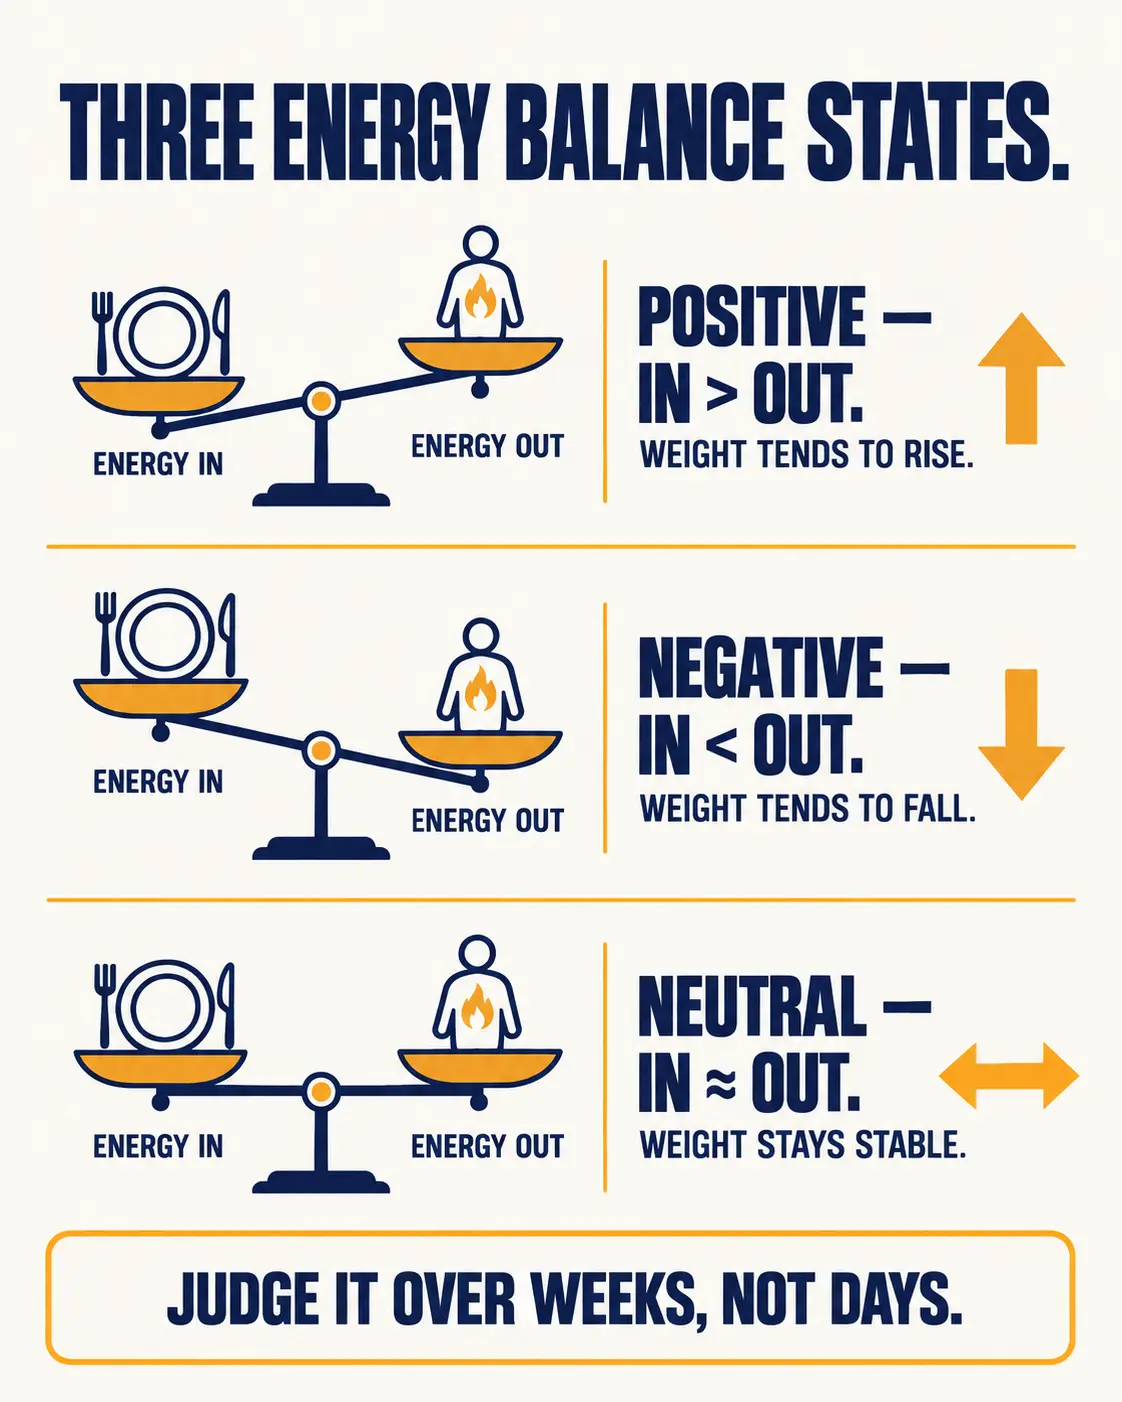
Energy balance is about the trend over weeks, not a single day. Daily weight can swing by a kilogram or more from water, stored carbohydrate (glycogen holds water — roughly 3 g for every gram of glycogen) and food still being digested. A coach reads the weekly average, not one morning's number.
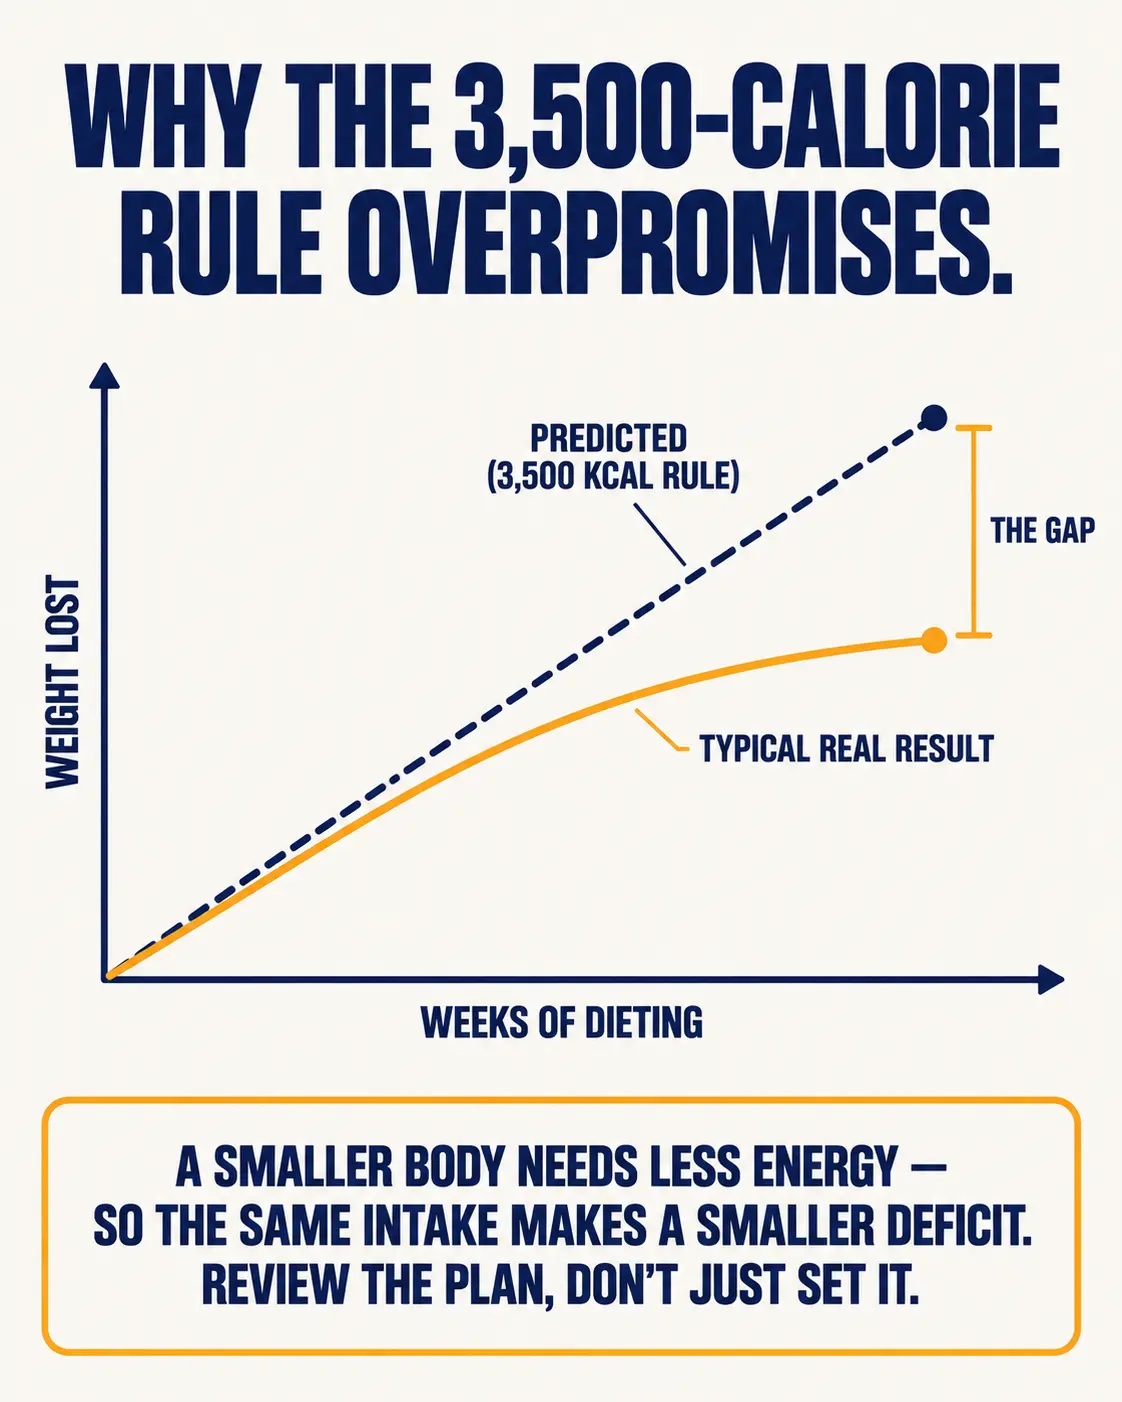
You'll often see the rule of thumb that about 3,500 kcal equals one pound of body fat (roughly 7,700 kcal per kilogram), so a 500 kcal daily deficit "should" produce about a pound of loss a week. It's a useful starting estimate, but it overstates long-term results: as someone loses weight, their body needs less energy to run, so the same intake produces a smaller deficit over time. That's why plans need reviewing, not just setting once. For more on this, see our post on why a bigger deficit doesn't mean faster fat loss.
Energy Density
Energy density is the number of calories in a given weight of food — usually expressed as kcal per gram. Foods high in water and fibre (vegetables, fruit, broth-based soups) tend to be low in energy density: you can eat a satisfying volume for relatively few calories. Foods high in fat and low in water (oils, nuts, fried snacks, many pastries) are high in energy density: small portions carry a lot of energy.
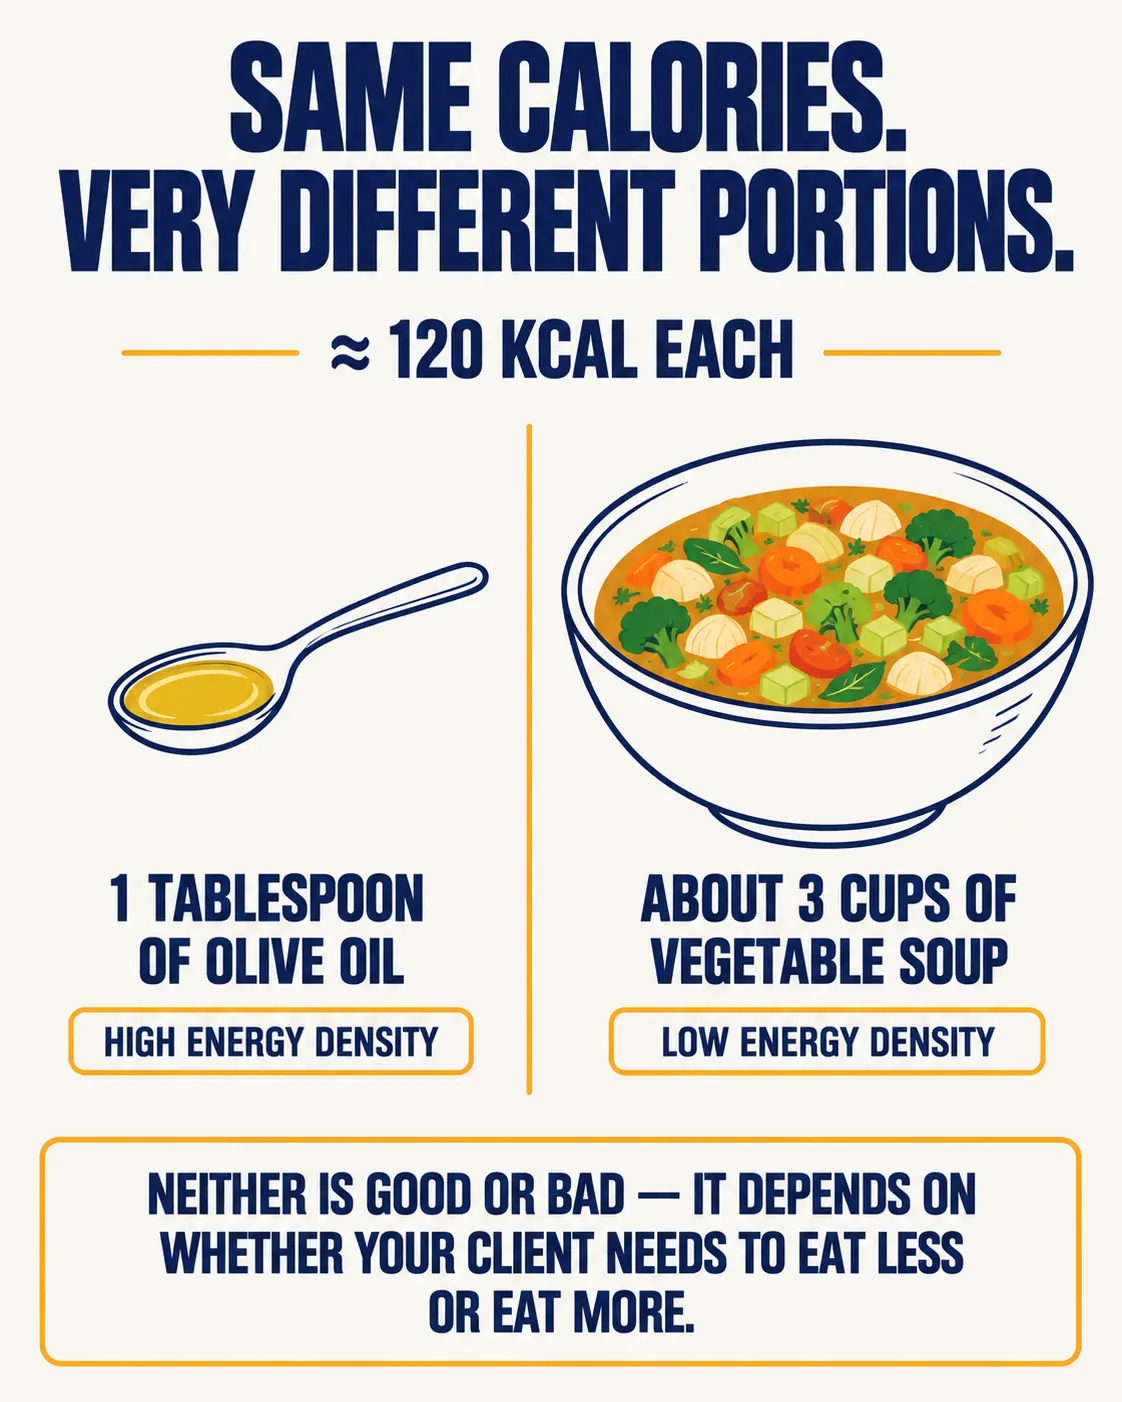
Neither is "good" or "bad." Nuts and olive oil are nutritious and energy-dense. The coaching value is practical: someone trying to eat less without feeling hungry often does better by building meals around lower energy-density foods, while someone struggling to eat enough — an athlete in heavy training, for example — may benefit from adding energy-dense foods.
The Four Parts of Daily Energy Expenditure
Total daily energy expenditure (TDEE) is the total energy a person uses in a day. It's made up of four components. The shares below are typical ranges — they vary a lot between people, especially the activity parts.
- Resting metabolic rate (RMR) — roughly 60–70%The energy needed to keep the body running at rest: breathing, circulation, brain function, maintaining body temperature, repairing tissue. The largest part of TDEE for almost everyone.
- Thermic effect of food (TEF) — roughly 10%The energy used to digest, absorb and process food. Higher-protein meals raise TEF slightly because protein has the highest thermic effect of the macronutrients.
- Non-exercise activity thermogenesis (NEAT) — highly variableEnergy from all movement that isn't planned exercise: walking around, standing, housework, fidgeting, taking the stairs. It can differ by several hundred calories a day or more between people of similar size.
- Exercise activity thermogenesis (EAT) — often 5–10%Energy from planned, structured exercise such as gym sessions, runs or classes. For most people it's a smaller share of daily energy use than they expect.
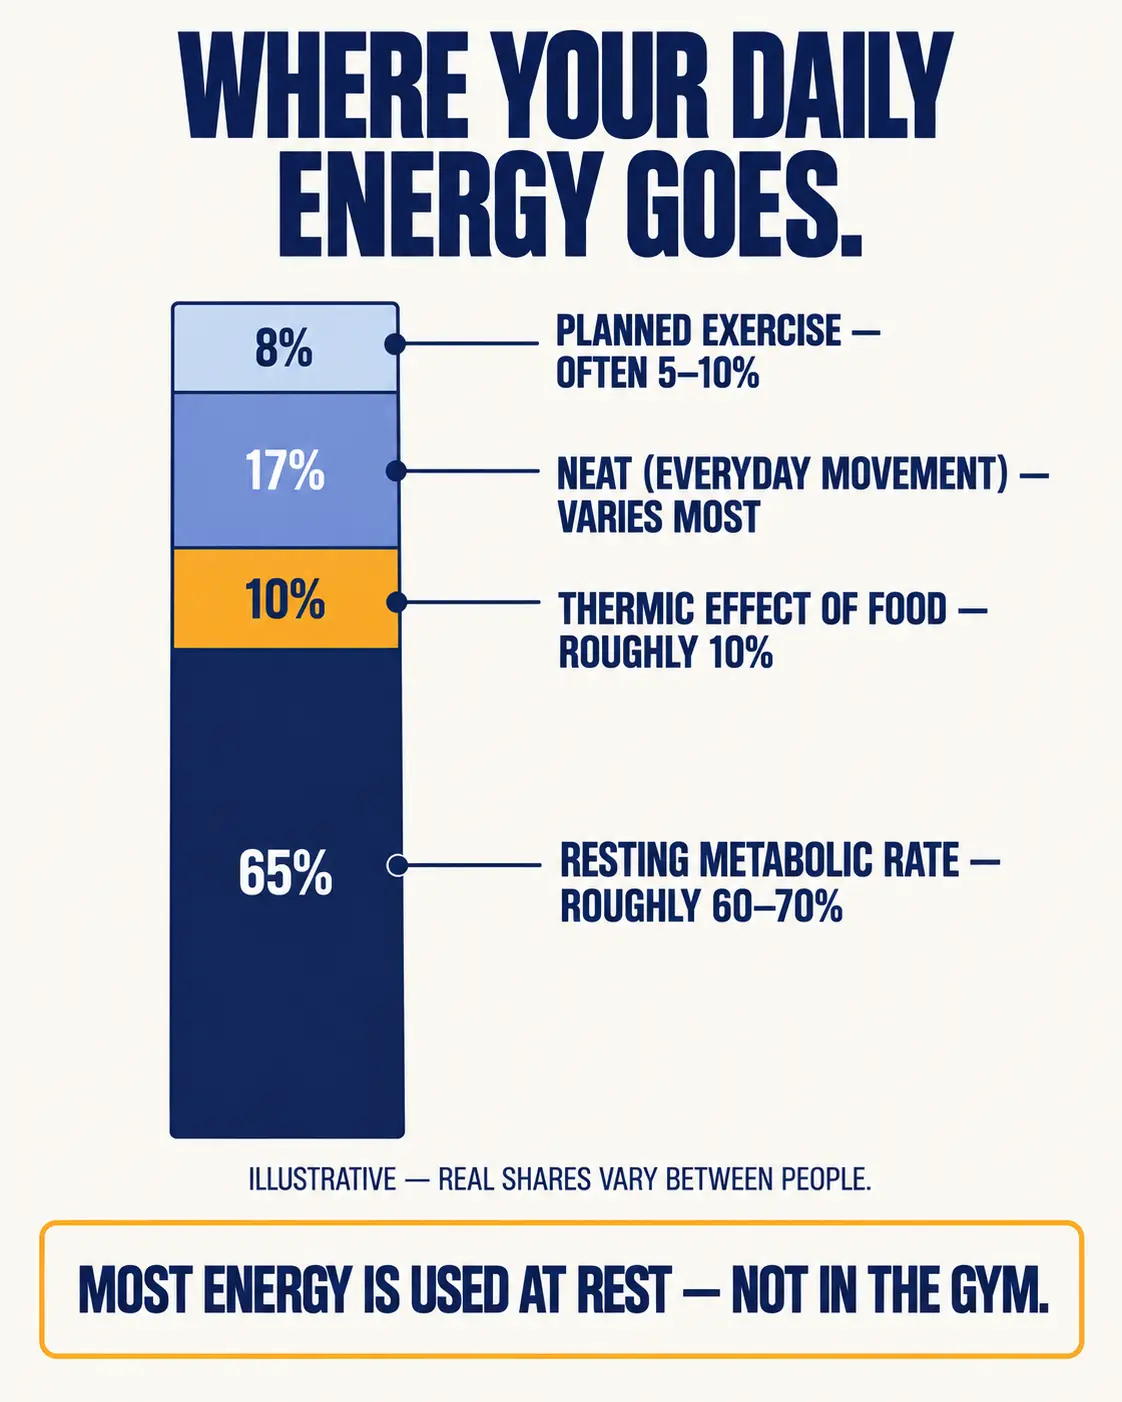
NEAT and EAT together are sometimes grouped as the "thermic effect of activity" (TEA). The key coaching insight is that NEAT is often a bigger, more flexible lever than exercise: adding daily steps or breaking up long periods of sitting can shift expenditure more than one extra workout a week. NEAT can also quietly drop during a diet — people tend to move a bit less without noticing — which is one reason progress slows.
- Basal metabolic rate (BMR)Energy use at rest measured under strict conditions: just after waking, after an overnight fast, fully rested, in a comfortable temperature.
- Resting metabolic rate (RMR)Energy use at rest measured under less strict conditions. Usually slightly higher than BMR. In practice the two terms are often used interchangeably.
Estimating Energy Needs
The most accurate ways to measure metabolic rate (such as indirect calorimetry, which measures oxygen used and carbon dioxide produced) need lab equipment. In everyday coaching, energy needs are estimated with prediction equations, then adjusted based on real results.
Step 1 — Estimate RMR
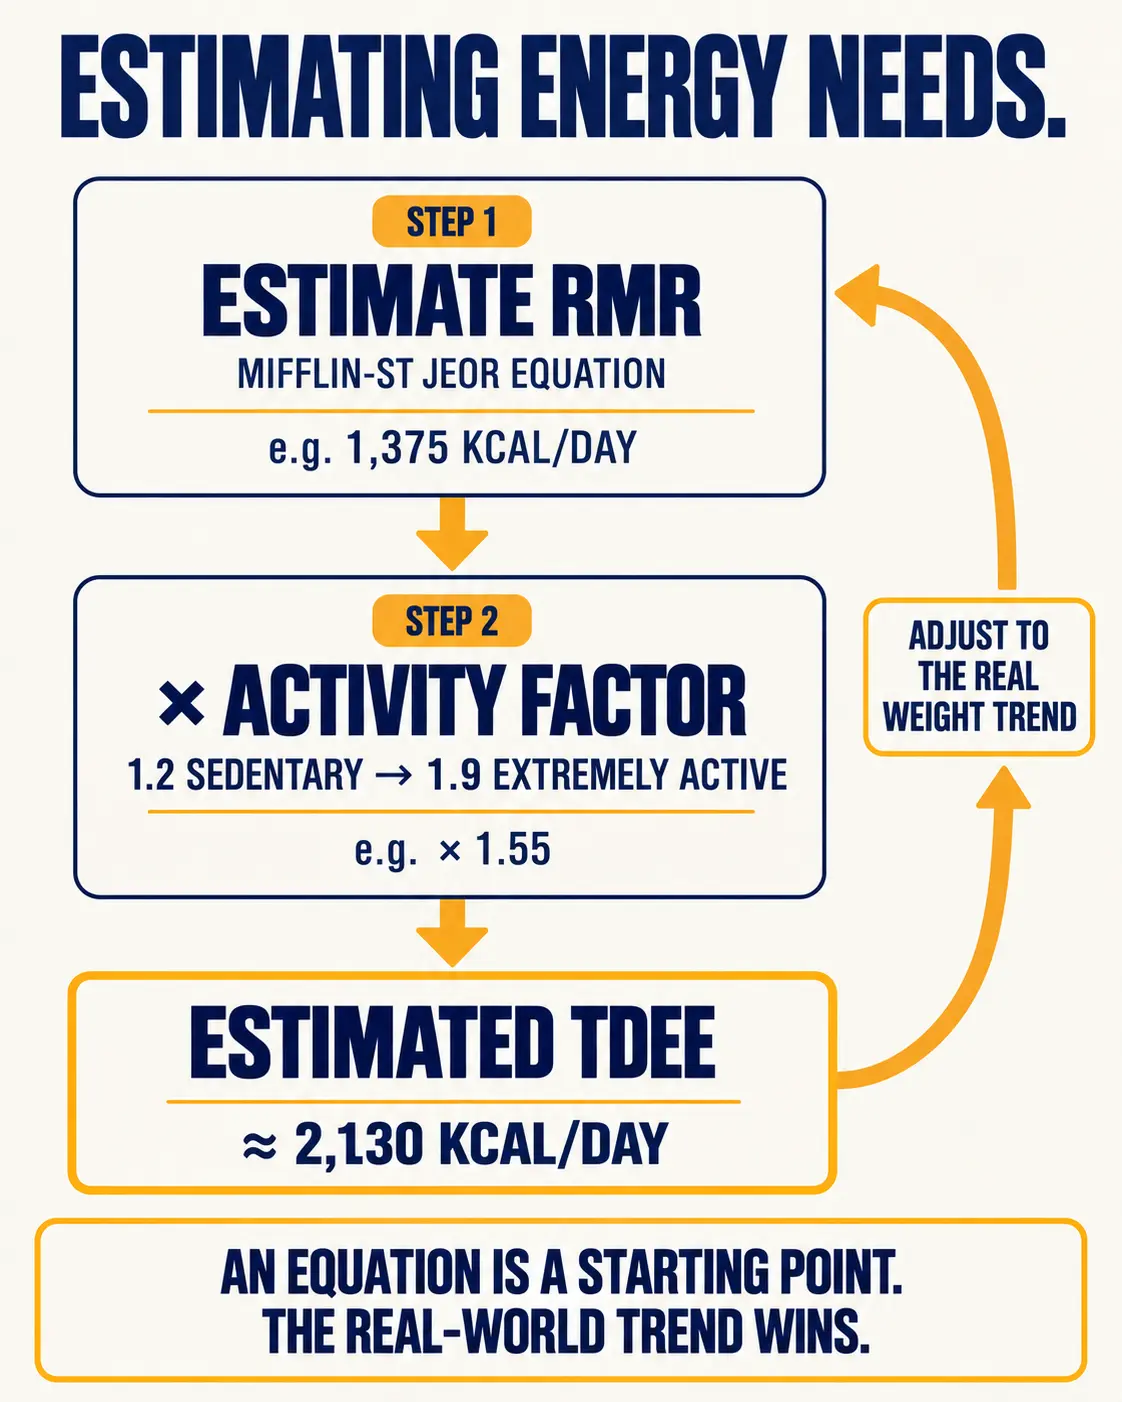
The Mifflin-St Jeor equation is widely used and considered one of the more reliable options for the general population. It uses weight in kilograms, height in centimetres and age in years:
| Group | Mifflin-St Jeor equation (kcal/day) |
|---|---|
| Men | (10 × weight kg) + (6.25 × height cm) − (5 × age) + 5 |
| Women | (10 × weight kg) + (6.25 × height cm) − (5 × age) − 161 |
Other equations exist. The older Harris-Benedict equation tends to overestimate for many people today. The Katch-McArdle equation — 370 + (21.6 × lean body mass in kg) — uses lean mass instead of total weight, so it can suit very lean or muscular people, but only if you have a reasonable body-composition estimate.
Step 2 — Multiply by an activity factor
To estimate TDEE, multiply RMR by an activity factor that reflects the person's overall daily movement:
| Activity level | Typical multiplier |
|---|---|
| Sedentary (mostly sitting, little exercise) | 1.2 |
| Lightly active (light exercise 1–3 days/week) | 1.375 |
| Moderately active (moderate exercise 3–5 days/week) | 1.55 |
| Very active (hard exercise 6–7 days/week) | 1.725 |
| Extremely active (physical job plus hard training) | 1.9 |
Anika is 35, weighs 68 kg (about 150 lb), is 165 cm tall (about 5 ft 5 in) and exercises moderately four days a week.
RMR = (10 × 68) + (6.25 × 165) − (5 × 35) − 161 = 680 + 1,031 − 175 − 161 ≈ 1,375 kcal/day
TDEE ≈ 1,375 × 1.55 ≈ 2,130 kcal/day
That's an estimate of her maintenance needs, not a prescription. If her weight trend over the next few weeks doesn't match what the estimate predicts, the estimate gets adjusted — the real-world trend wins.
People commonly over-report activity, and activity trackers vary in accuracy, so it's usually safer to start with a conservative activity factor and adjust. Energy targets for anyone with a medical condition, pregnancy, or a history of disordered eating are outside a coach's role — those clients should be working with a doctor or registered dietitian.
Metabolism and What Influences It
Metabolism is the sum of all the chemical reactions in the body. It has two sides: catabolism breaks larger molecules down (for example, breaking down stored fat or glycogen to release energy), and anabolism builds larger molecules up (for example, building muscle protein). The energy released from food is captured mainly as ATP, the molecule cells use to power their work.
- Body size and compositionLarger bodies use more energy. Lean tissue such as muscle uses more energy at rest than fat tissue, so people with more lean mass tend to have a higher RMR.
- AgeRMR tends to decline gradually with age, partly because many people lose lean mass over time. Staying active and doing resistance training helps offset this.
- SexOn average, men have higher RMRs than women, largely because of differences in body size and lean mass — which is why the equations differ.
- Genetics and hormonesIndividuals differ naturally, and hormones such as thyroid hormones influence metabolic rate. Suspected hormonal problems need a doctor, not a coach.
- Energy intake and dieting historyDuring a sustained deficit, expenditure tends to drop somewhat more than weight loss alone would predict — often called metabolic adaptation or adaptive thermogenesis. It's real but usually modest, and it doesn't stop weight loss.
Clients often blame a "slow metabolism" when progress stalls. Sometimes adaptation plays a part, but more often intake has crept up, NEAT has dropped, or food tracking is less accurate than it seems. The coaching move is to review habits and trends calmly with the client — and to refer to a doctor if they report symptoms that suggest a medical cause.
If you've studied other courses on this site, this chapter overlaps with PN Level 1's metabolism chapter and NASM-CPT's exercise metabolism lesson — useful for extra practice from a different angle.
11 questions in the style of the CNC exam. Score 70%+ to mark this lesson complete.
- Protein and carbohydrate provide about 4 kcal per gram, fat about 9, and alcohol about 7.
- Positive energy balance tends to raise body weight, negative lowers it, and neutral maintains it — judged over weeks, not days.
- Energy-dense foods pack more calories into less weight; water- and fibre-rich foods do the opposite.
- TDEE = RMR (largest share) + TEF + NEAT + exercise. NEAT varies the most between people.
- Estimate RMR with an equation such as Mifflin-St Jeor, multiply by an activity factor for TDEE, then adjust based on the real-world trend.
- Body size, lean mass, age, sex, genetics, hormones and dieting all influence metabolism; suspected medical causes go to a doctor.
Before moving to Lesson 6:
- Work out the calories in one meal you ate today from its protein, carbohydrate and fat grams.
- Estimate your own RMR and TDEE with the Mifflin-St Jeor equation and an activity factor.
- List three everyday ways someone could raise their NEAT without adding a workout.
- Complete the knowledge check above and review any question you missed.